Case study · HaldenPublished
Keeping a sales pipeline current without the data entry
Sales reps spend hours copying calls and emails into the CRM, and anything they don't type in never reaches the pipeline. Halden connects to email, calendar, and calls so the activity logs itself. The dashboard then shows which deals are going cold and what to do next, and every call turns into notes and tasks.
- Web app
- B2B SaaS
- Sales & CRM
- Product design
- UX & UI
- Dashboard design
At a glance
- Platform
- Web, desktop
- Who it's for
- B2B sales reps and their managers
- Our role
- Product design, UX, UI, prototype
- Year
- 2026
The problem
Reps sell, then spend the rest of the day writing up what they did. Managers rebuild the forecast in spreadsheets because they don't trust the CRM. We wanted a tool that stays accurate without the typing and tells each person where to spend the next hour.
- 01
Activity logged by hand
Reps copy calls, emails, and meetings into the CRM after the fact. Whatever doesn't get typed in is invisible to everyone else.
- 02
Deals go cold quietly
A proposal nobody has touched in two weeks looks exactly like one that got a reply yesterday.
- 03
Calls disappear when they end
What the customer said about pricing, competitors, or security ends up in one rep's notes, if it's written down at all.
- 04
Forecasts nobody trusts
Managers rebuild the forecast in a spreadsheet every week because stage probabilities and close dates are out of date.
How we approached it
- 01
Connect everything on day one
Onboarding asks for email, calendar, and calls in its second step, because that connection is what keeps the pipeline accurate.
- 02
Show the risk first
The dashboard opens on deals going cold, follow-ups due, and deals ready to close, with a short summary of what changed.
- 03
Turn calls into work
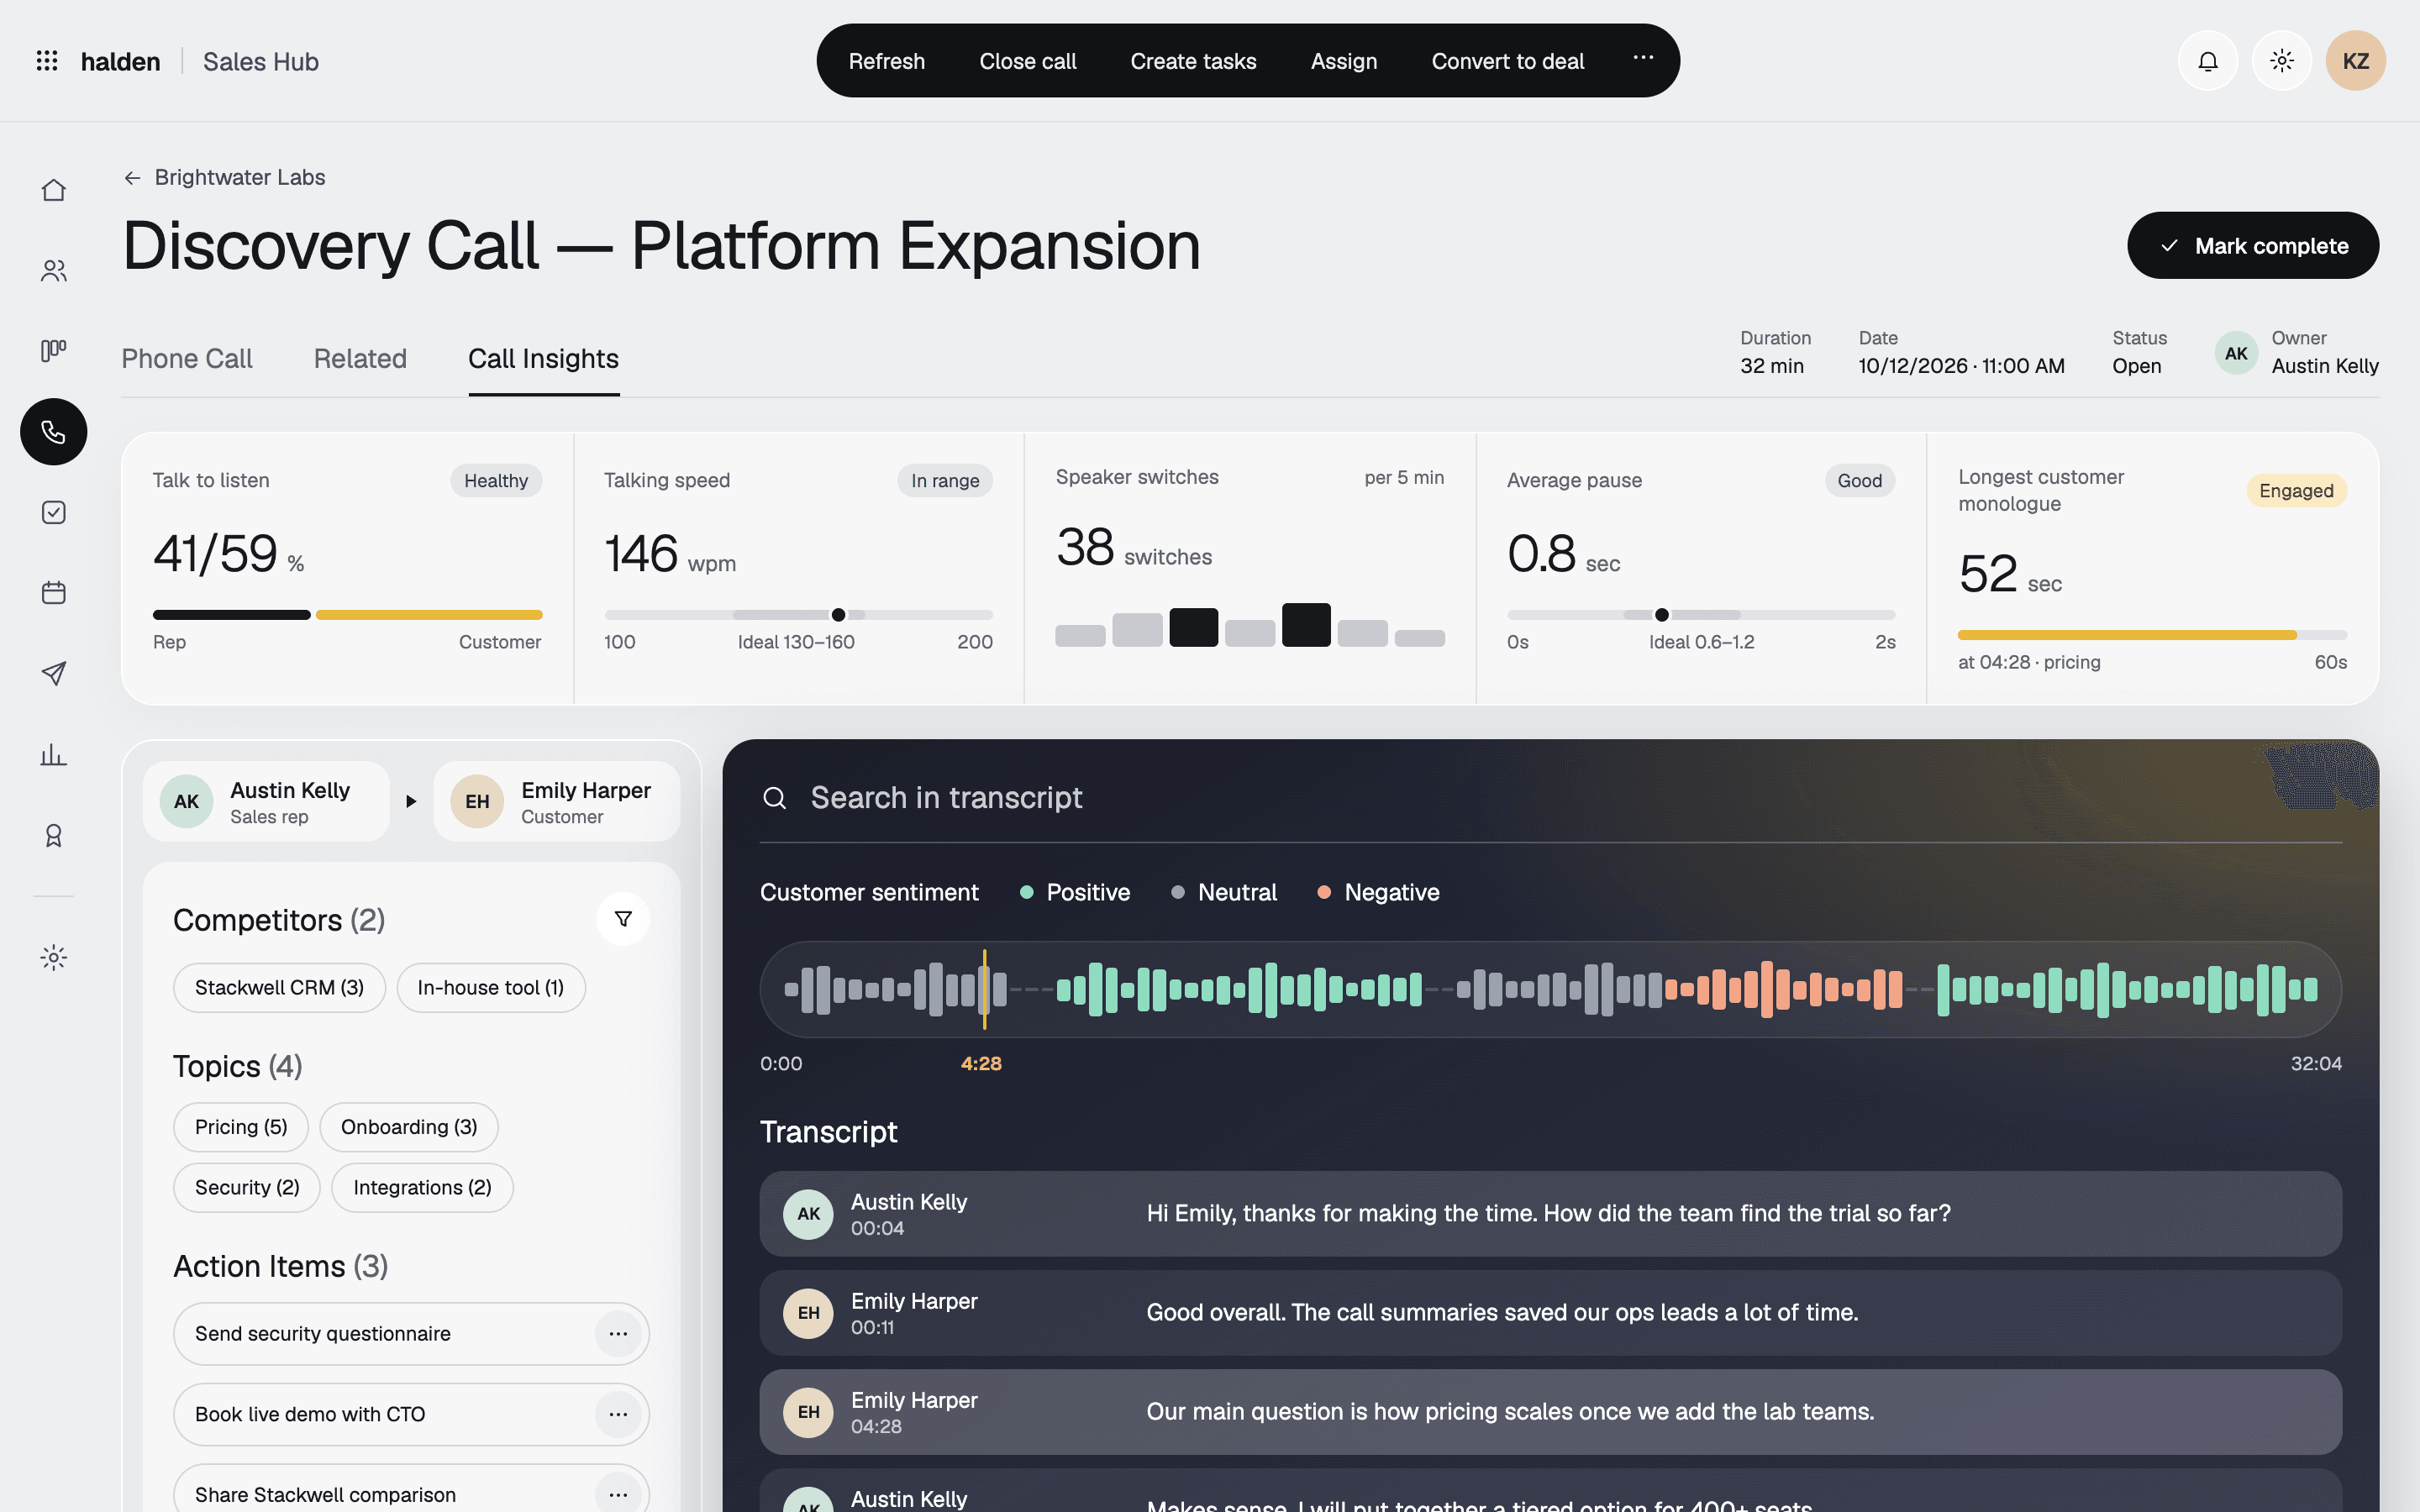
Call insights pull out topics, competitors, and action items, and the action items become tasks in one click.
- 04
Always show the next step
Every prospect, deal, and task carries its next step, who owns it, and when it's due.
Getting set up
The problemA CRM that starts empty tends to stay empty. Teams give up before the data is in.
What we did
- The first step asks about the company and how it sells, then suggests pipeline stages and previews the workspace while the form fills in.
- Connecting email, calendar, and calls is the second step. Any of them can be skipped and connected later from Settings.
- The last step invites teammates with their roles and sets the quarter's targets, which gives the reports something to measure against from the first day.
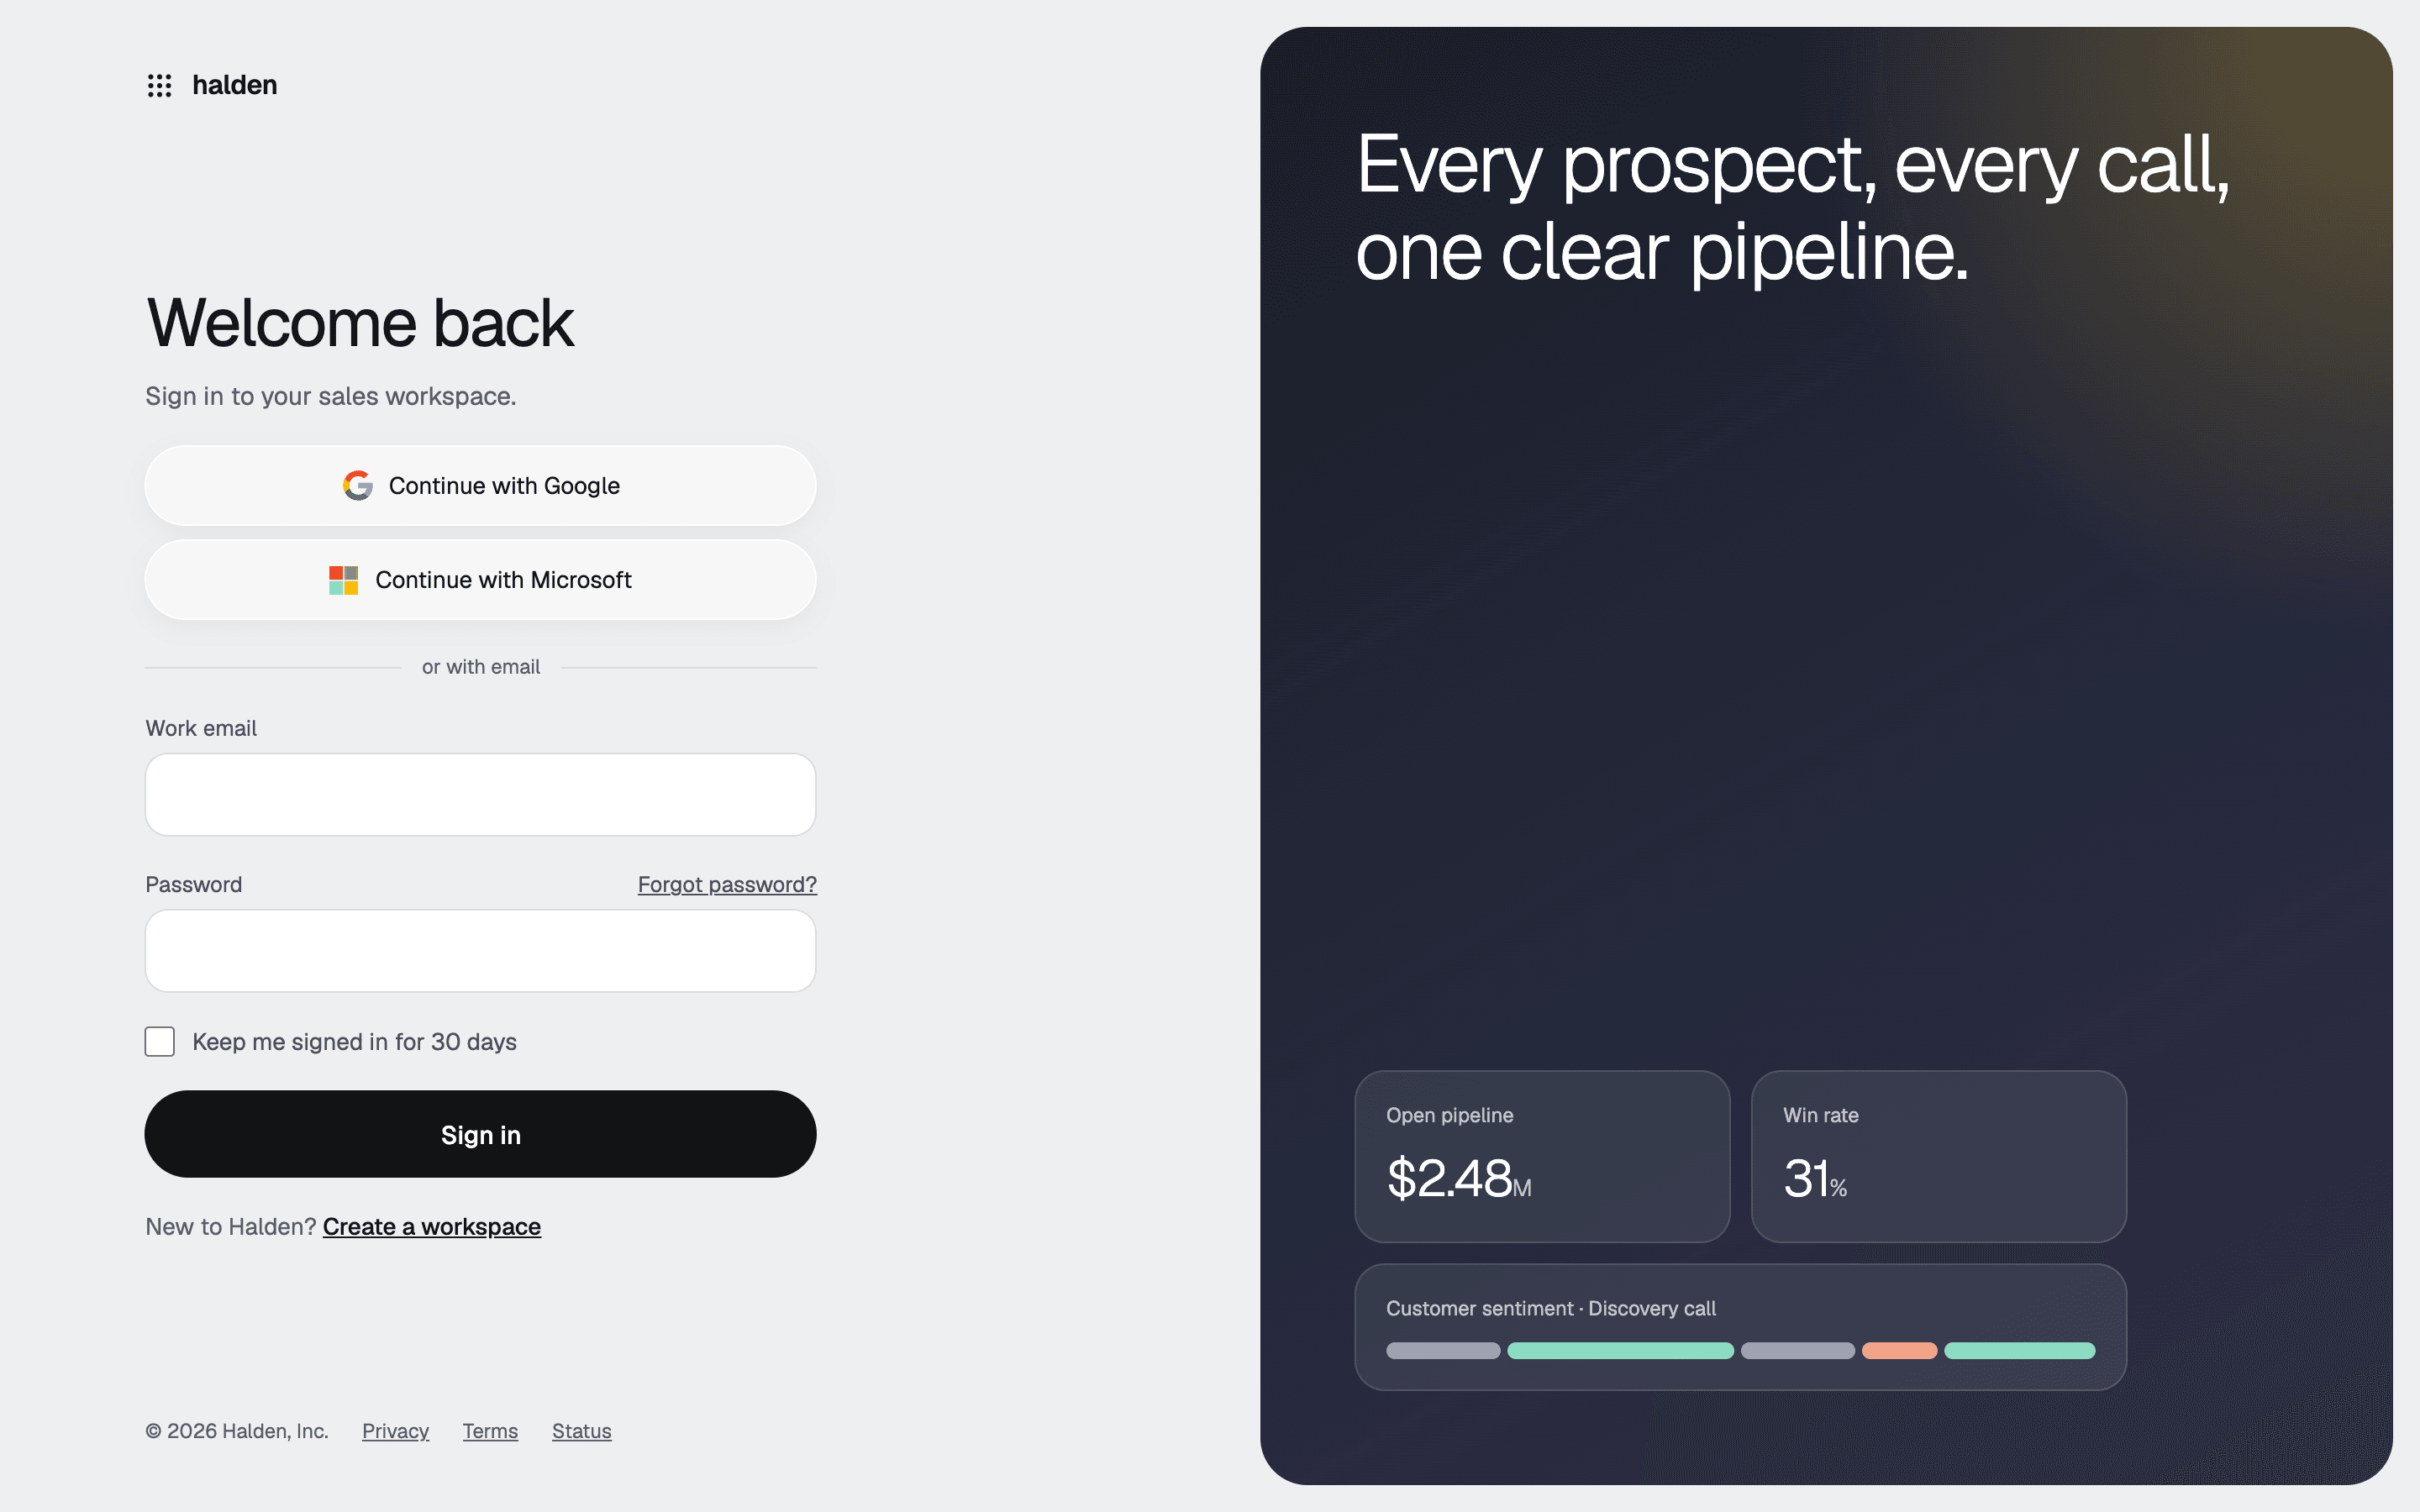
Sign inGoogle, Microsoft, or email. 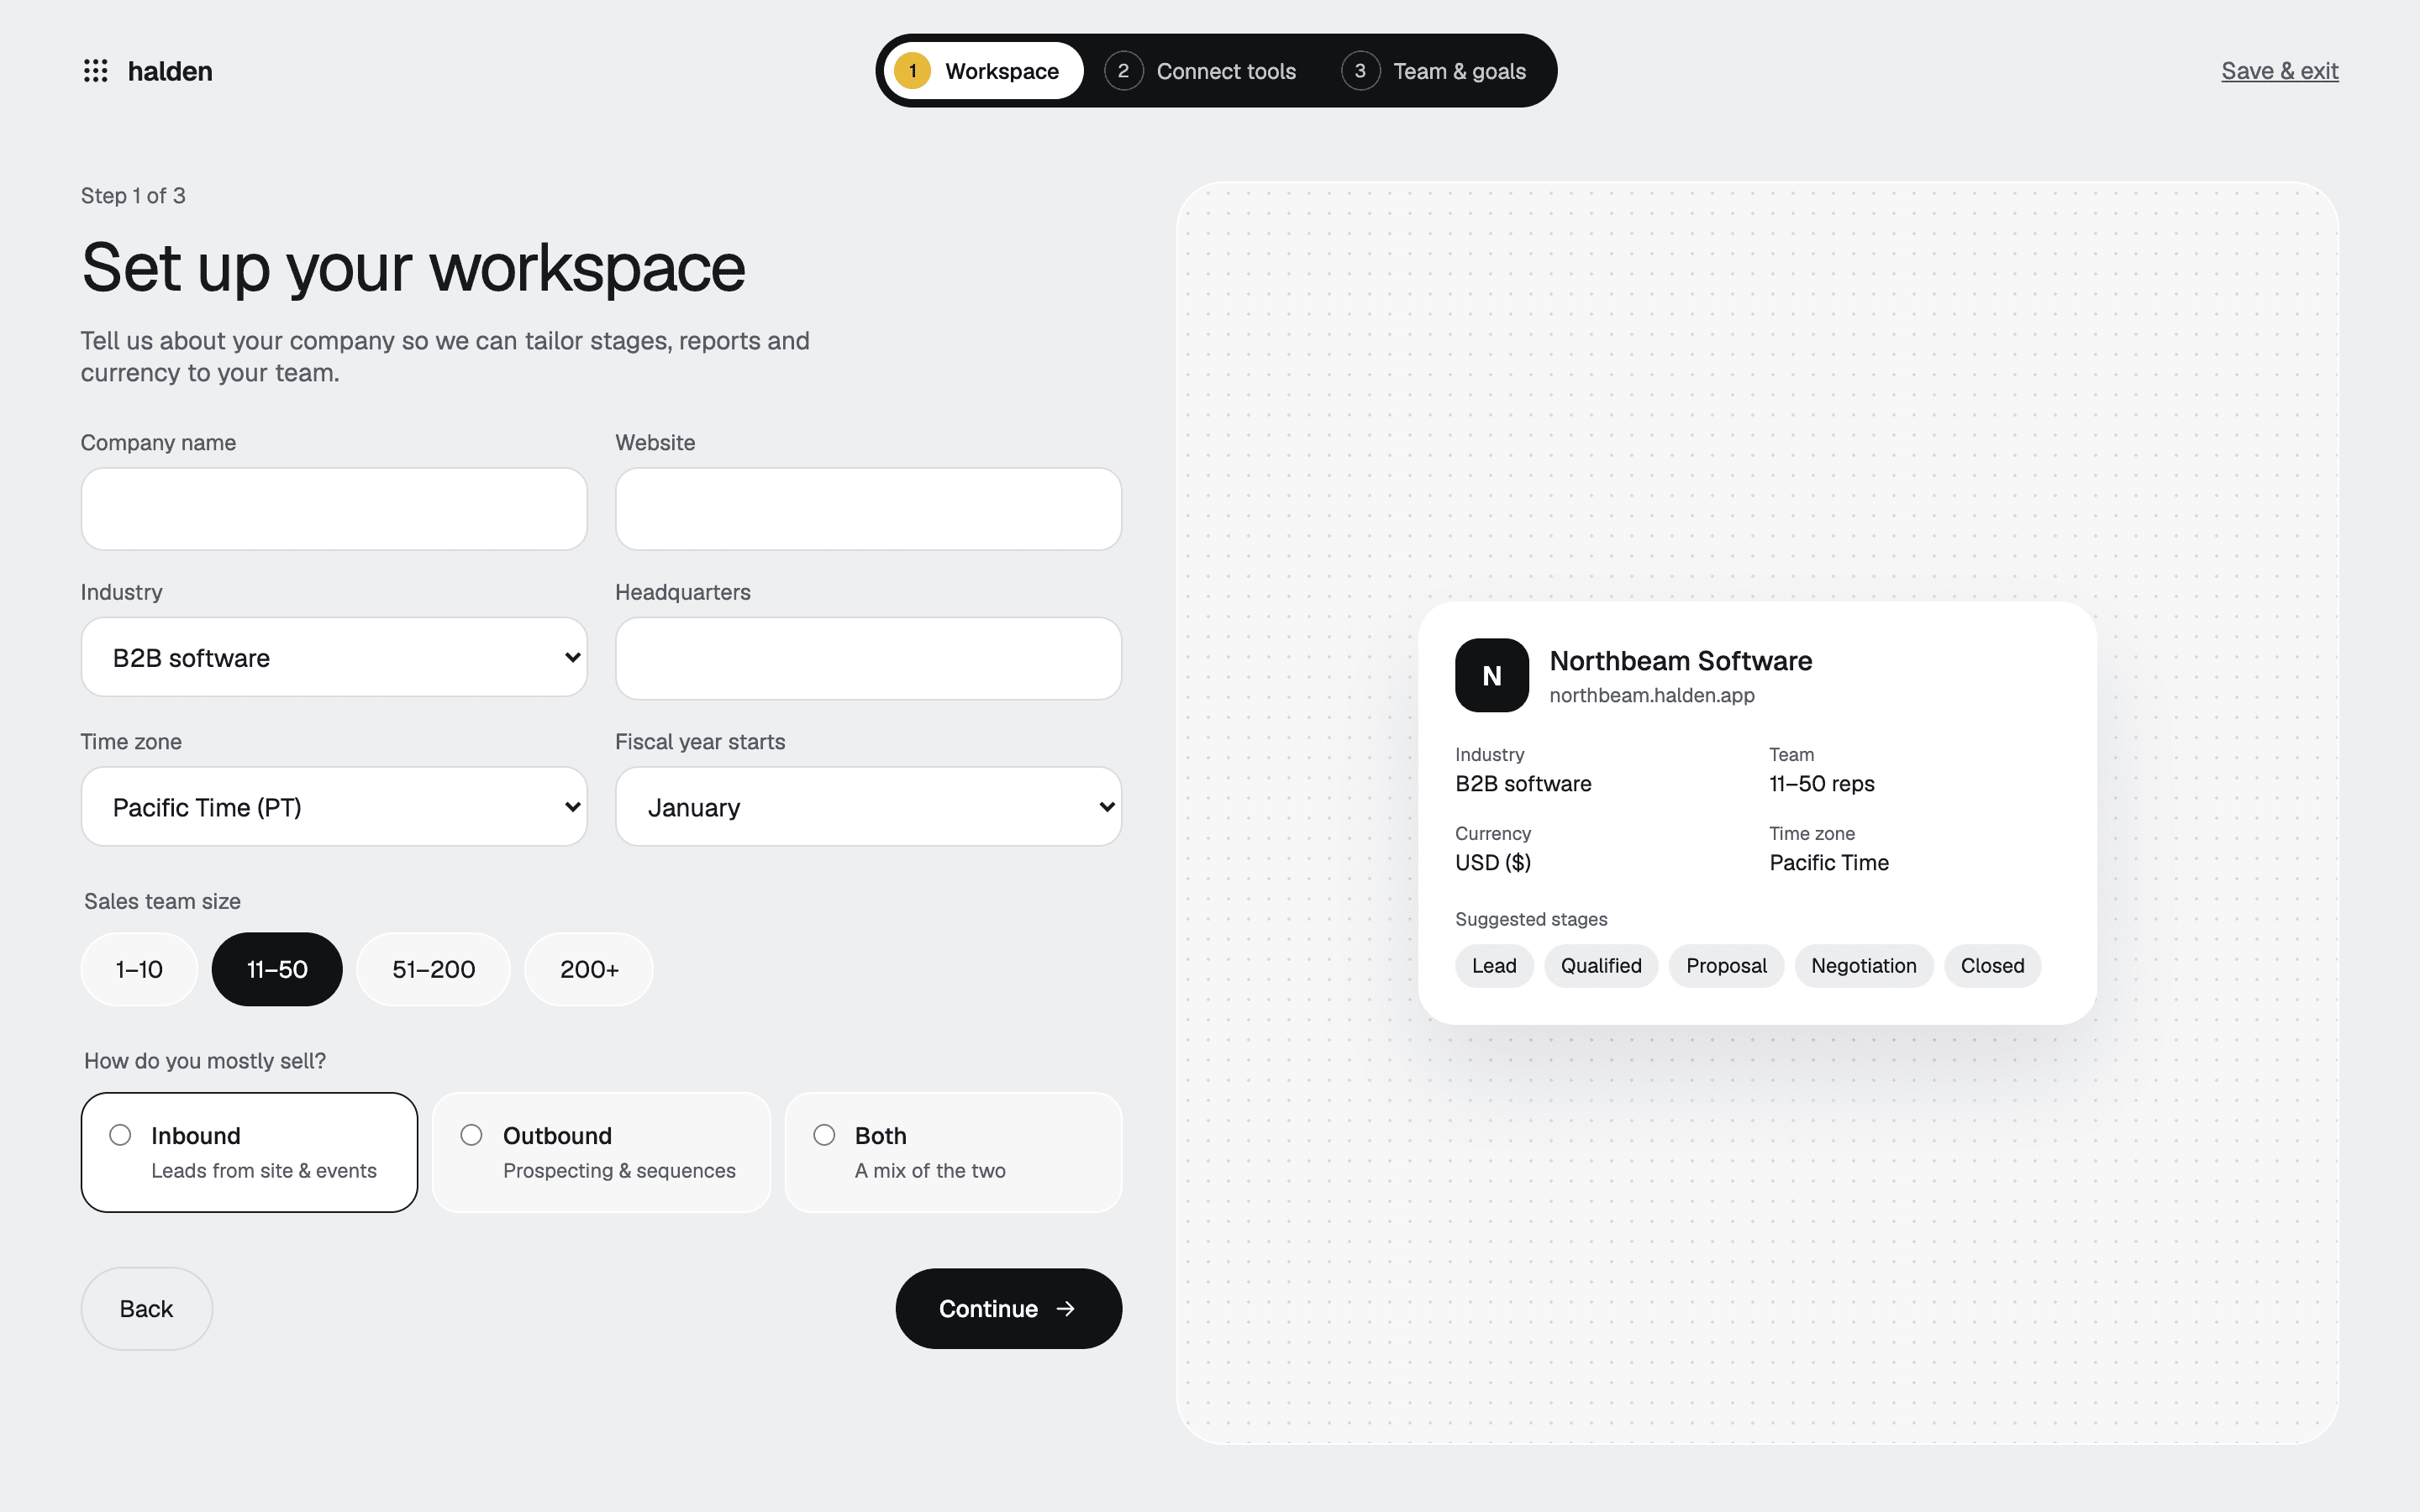
WorkspaceCompany details, with a live preview of the workspace. 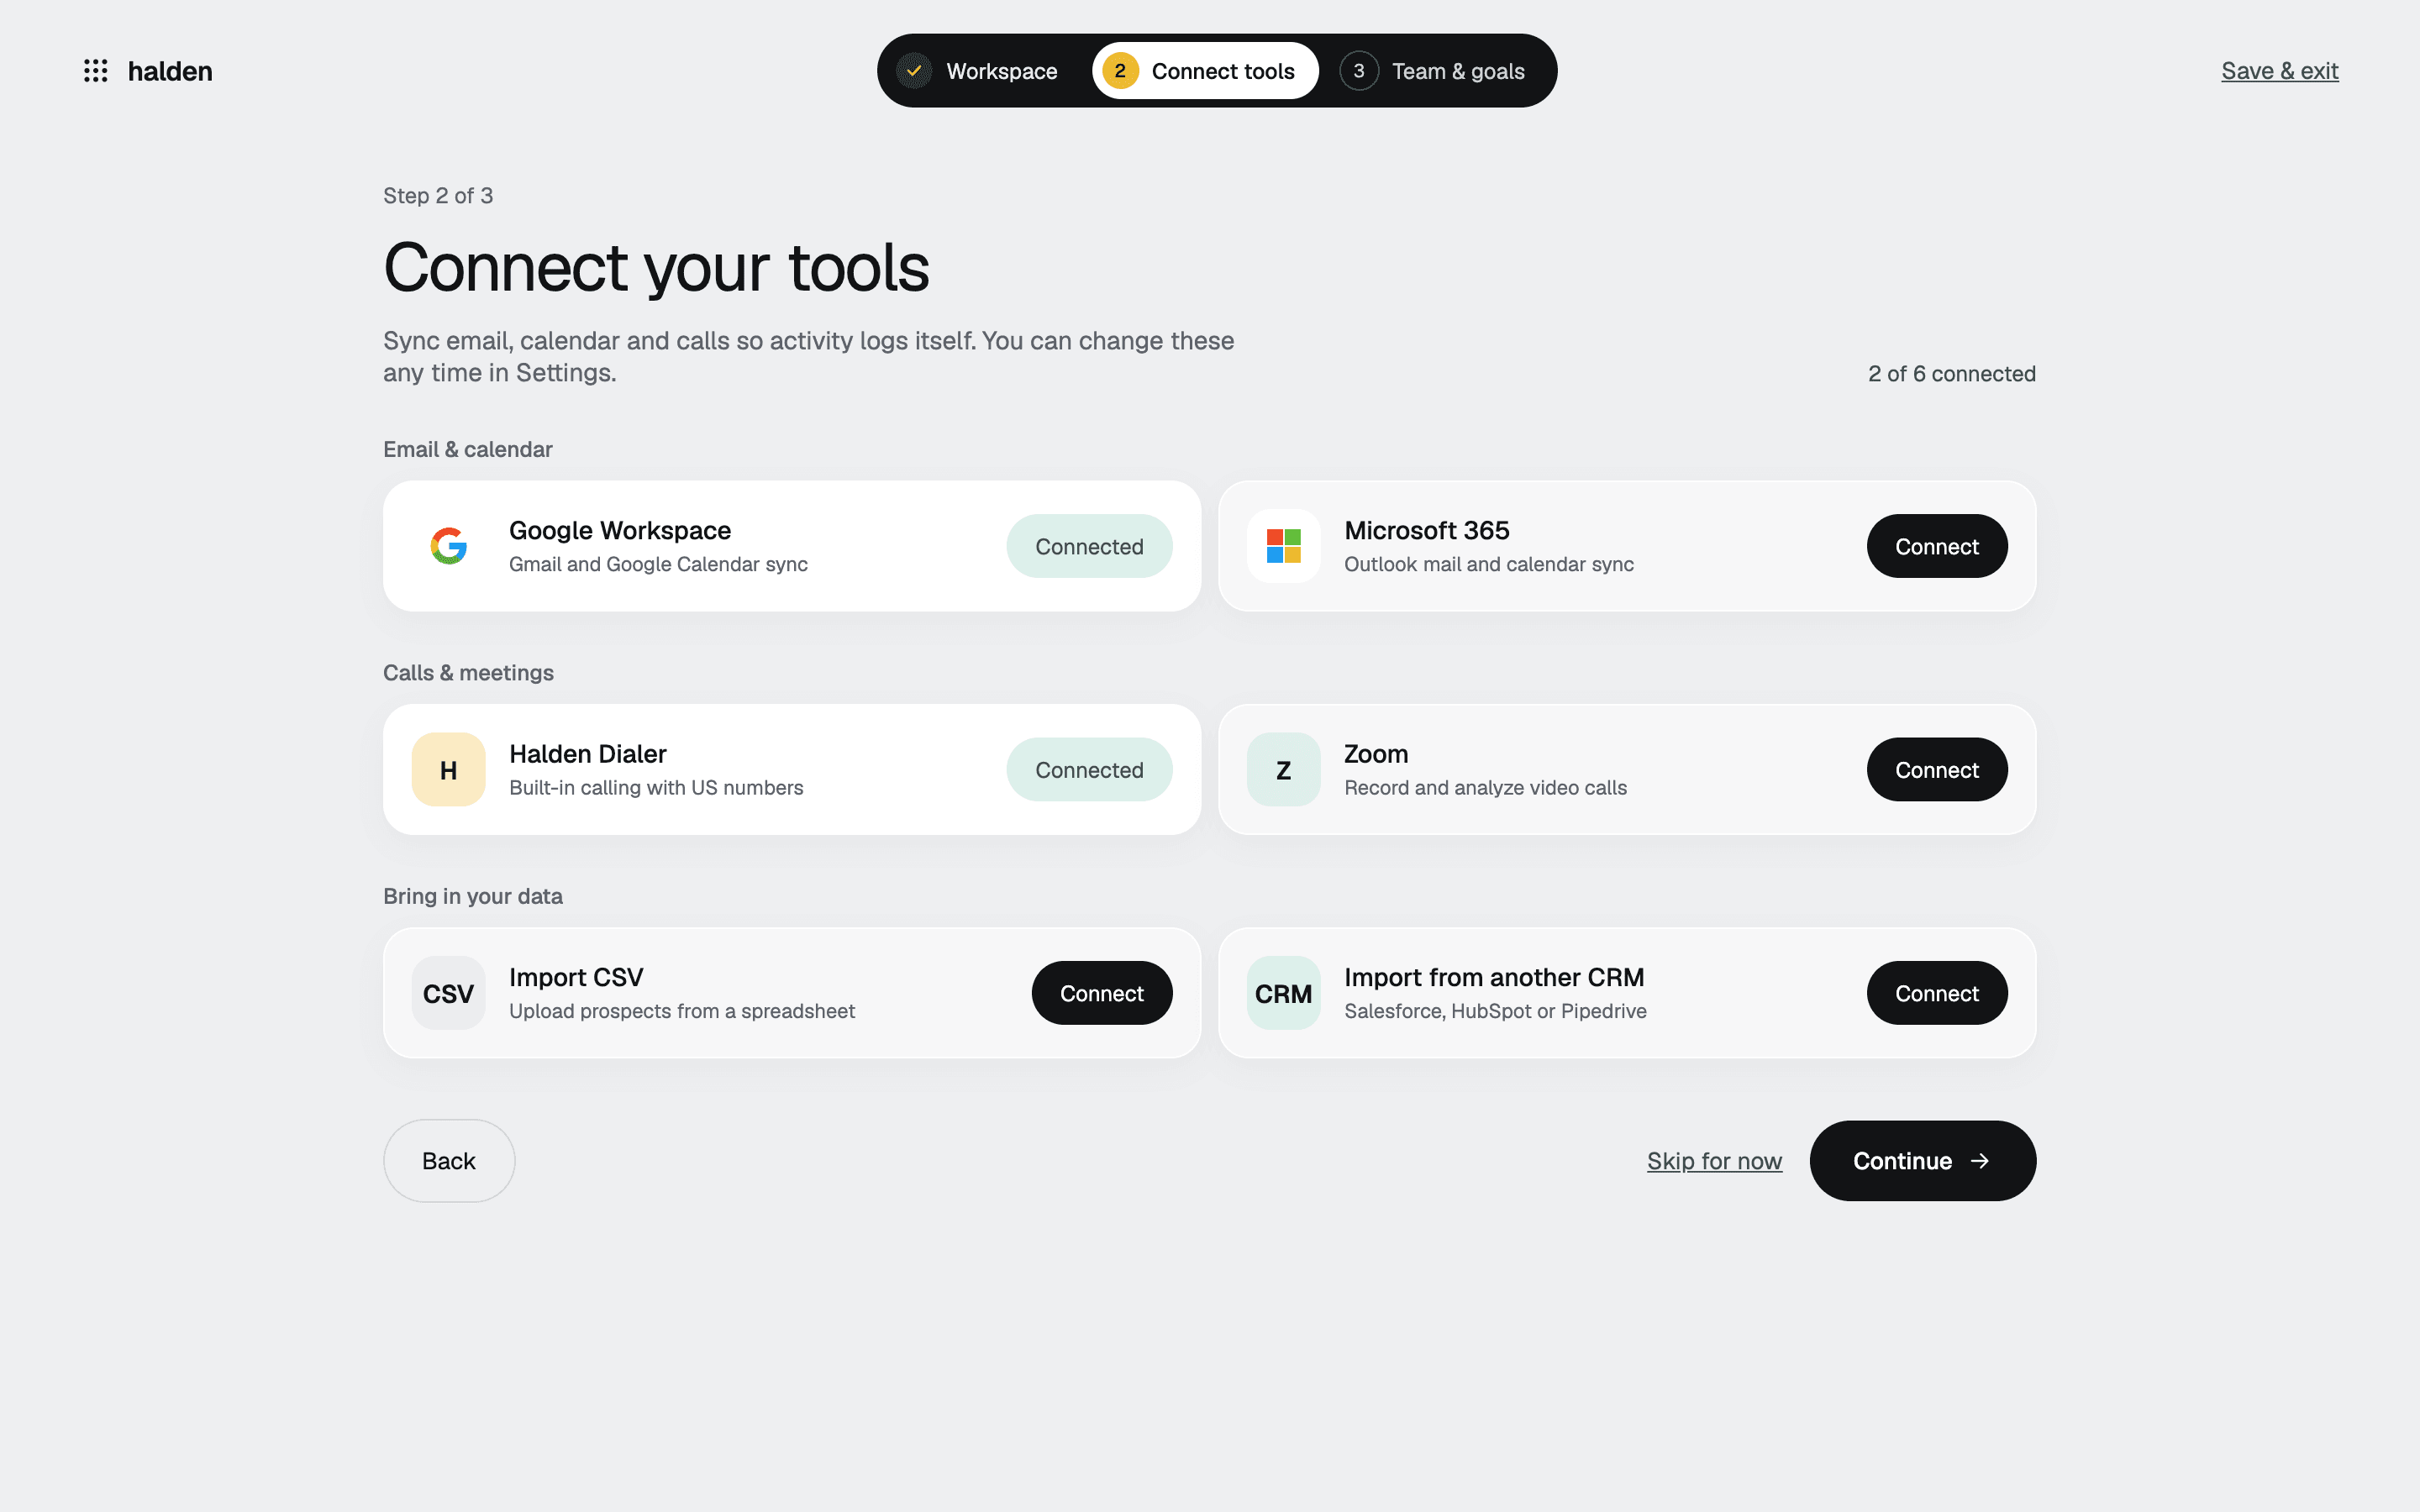
Connect toolsEmail, calendar, calls, and data import. 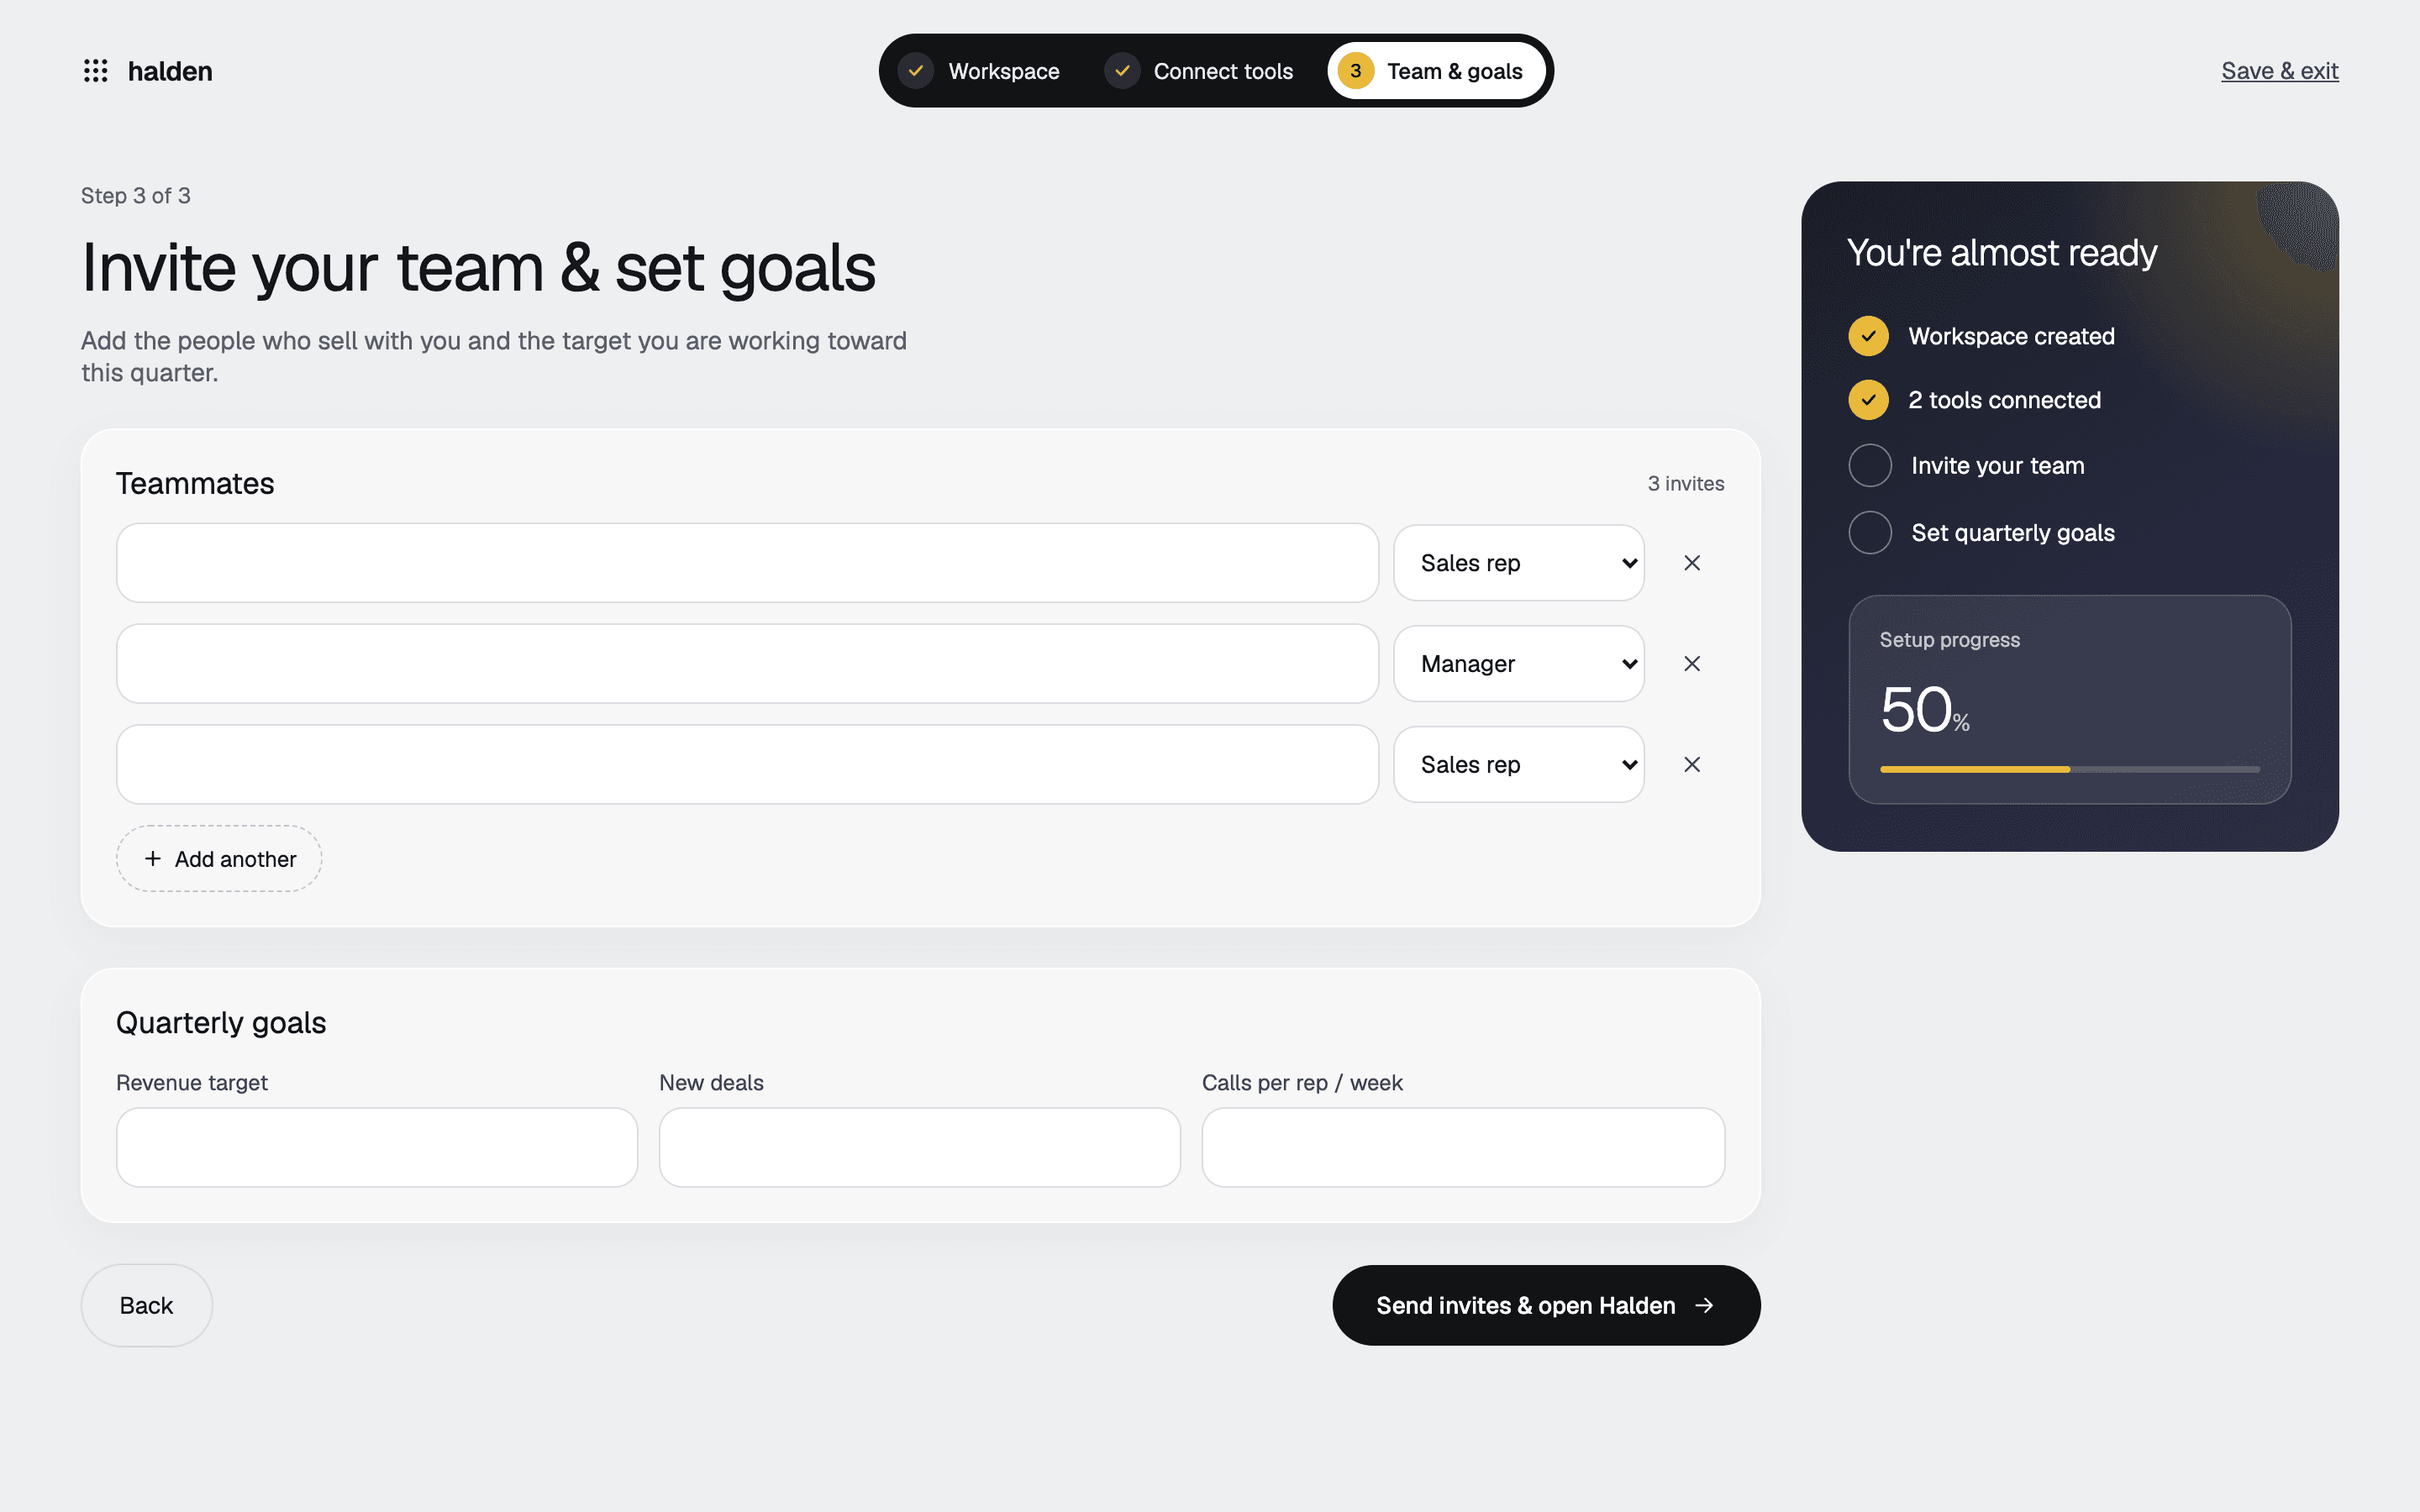
Team and goalsInvites, roles, and the quarter's targets.
The daily workspace
The problemReps start each day working out what to do instead of doing it.
What we did
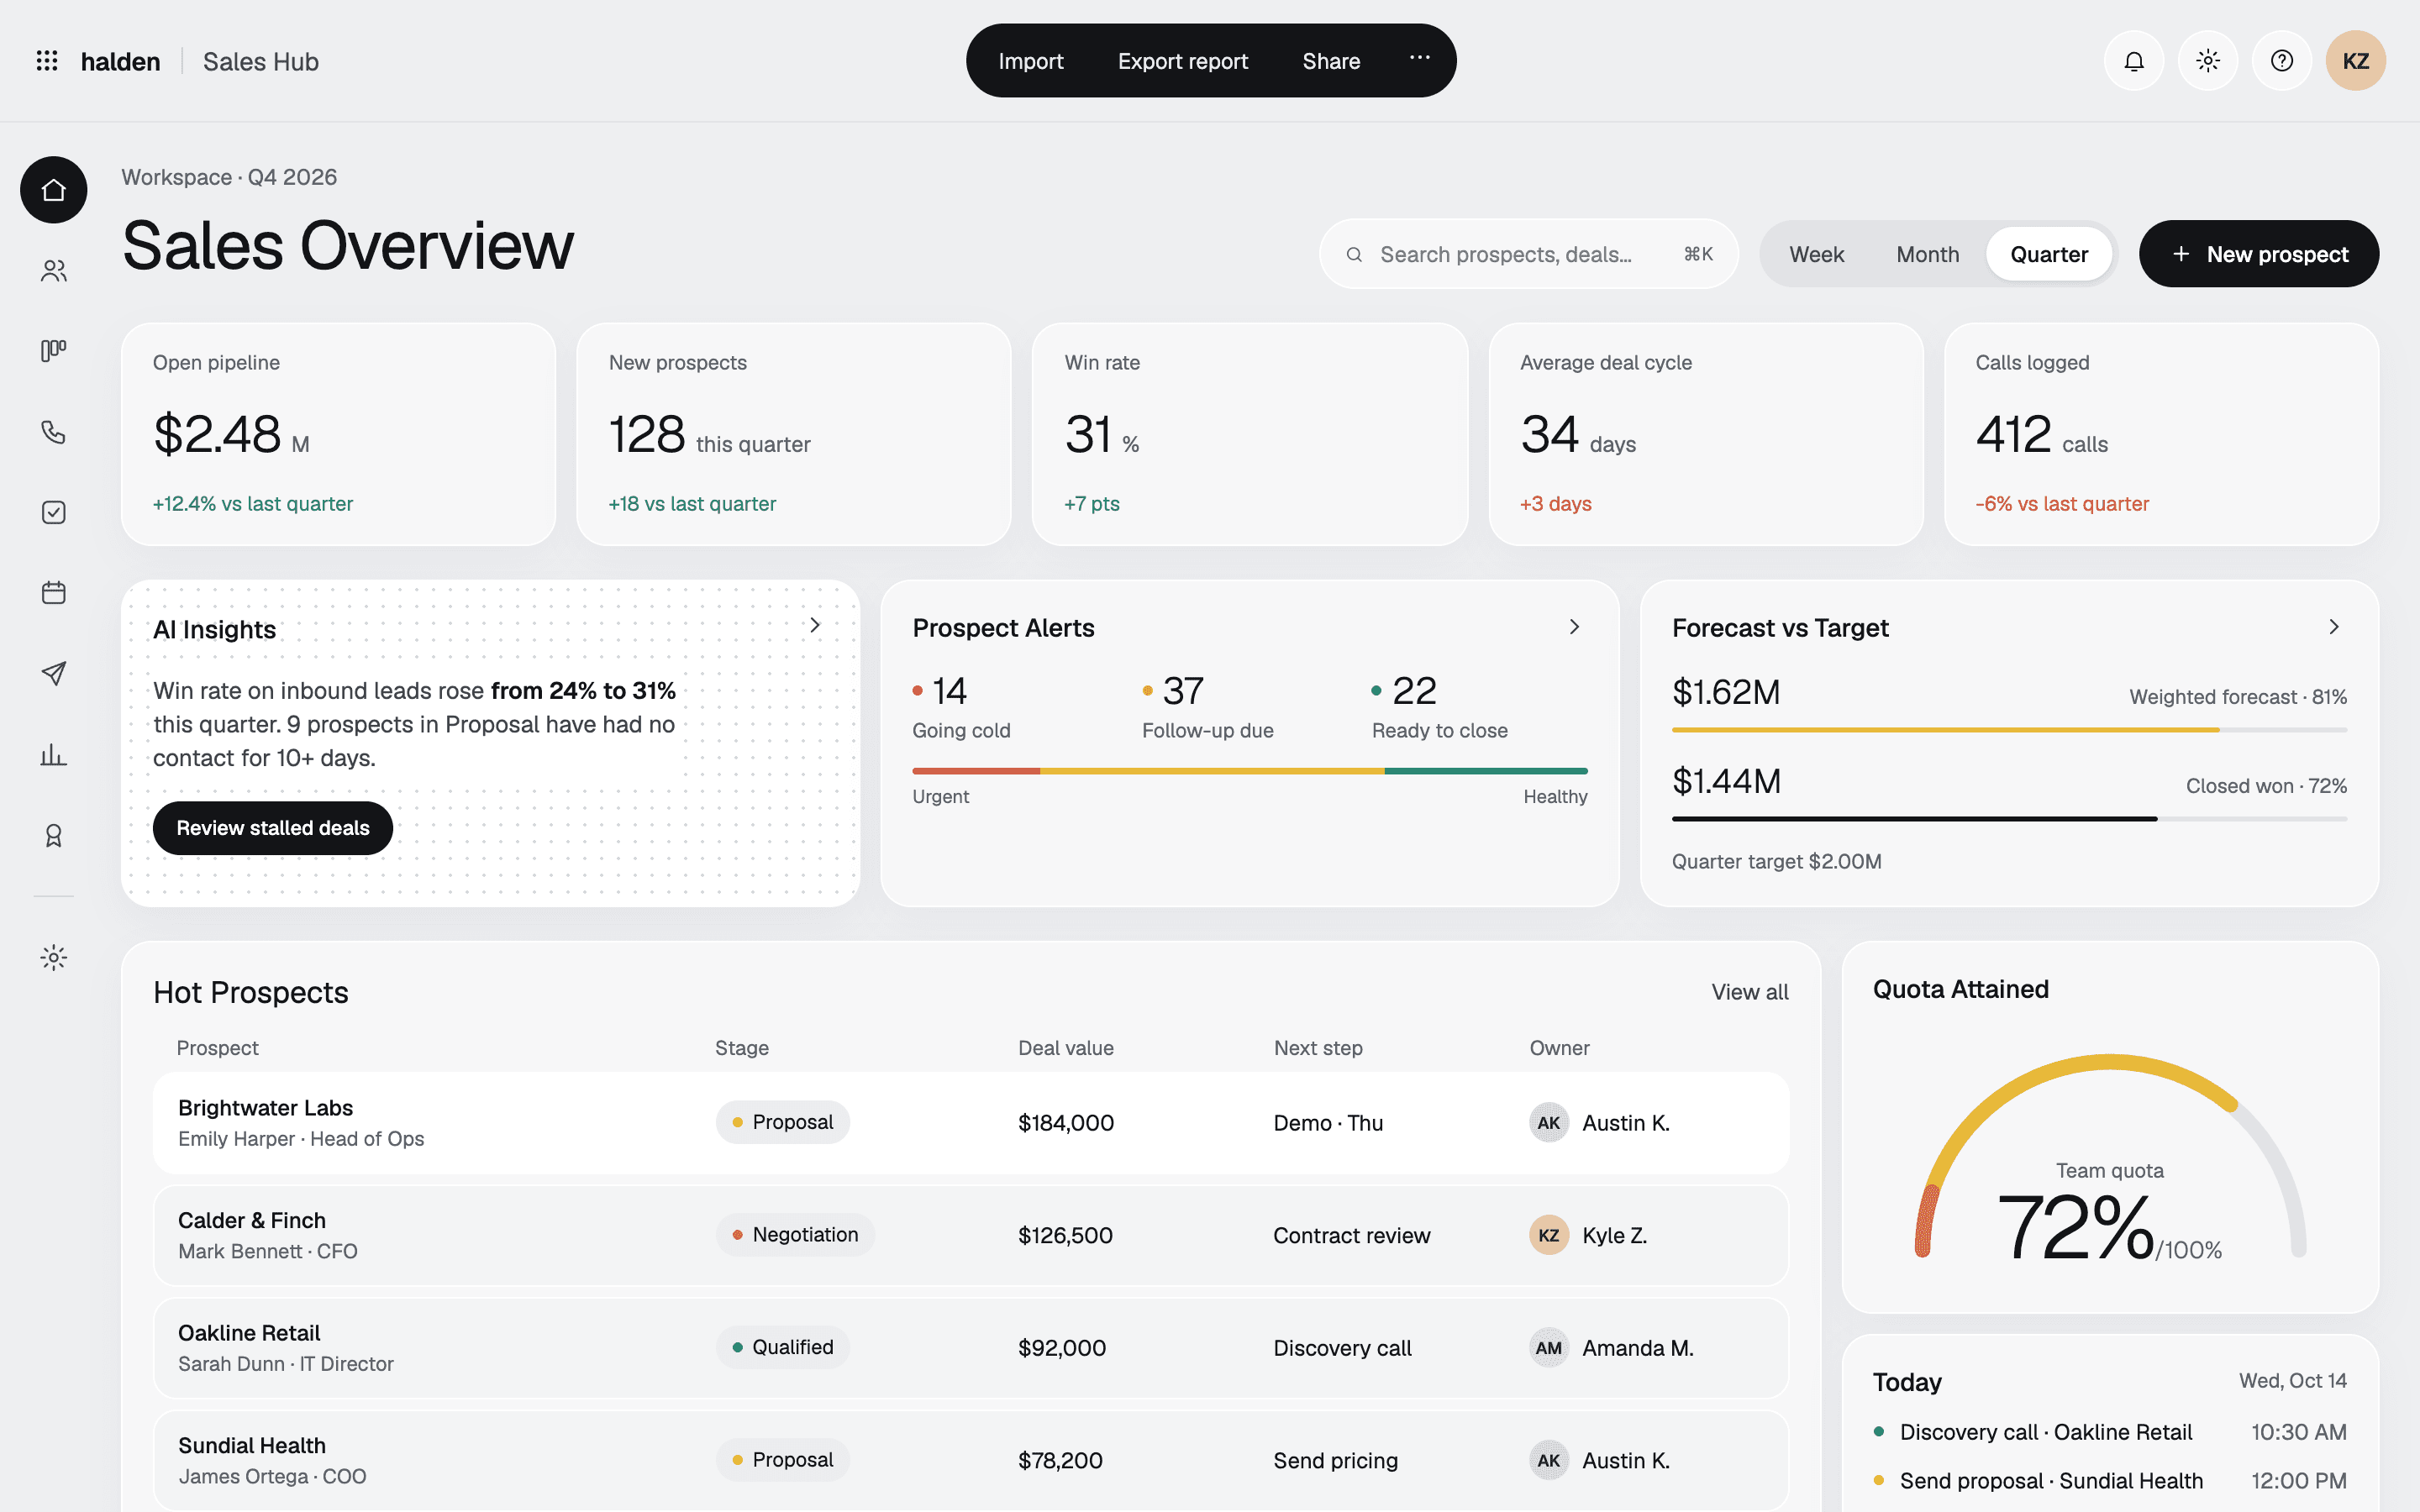
- The dashboard puts alerts for deals going cold, follow-ups due, and deals ready to close next to the headline numbers.
- AI insights explain what changed in a sentence, such as nine proposals that haven't been contacted in ten days.
- Tasks are grouped into overdue, today, and tomorrow, with one suggested next call and a power hour mode for making calls back to back.
- The calendar pins the next meeting and its prep notes beside the week view.
DashboardPipeline, alerts, AI insights, and the forecast. 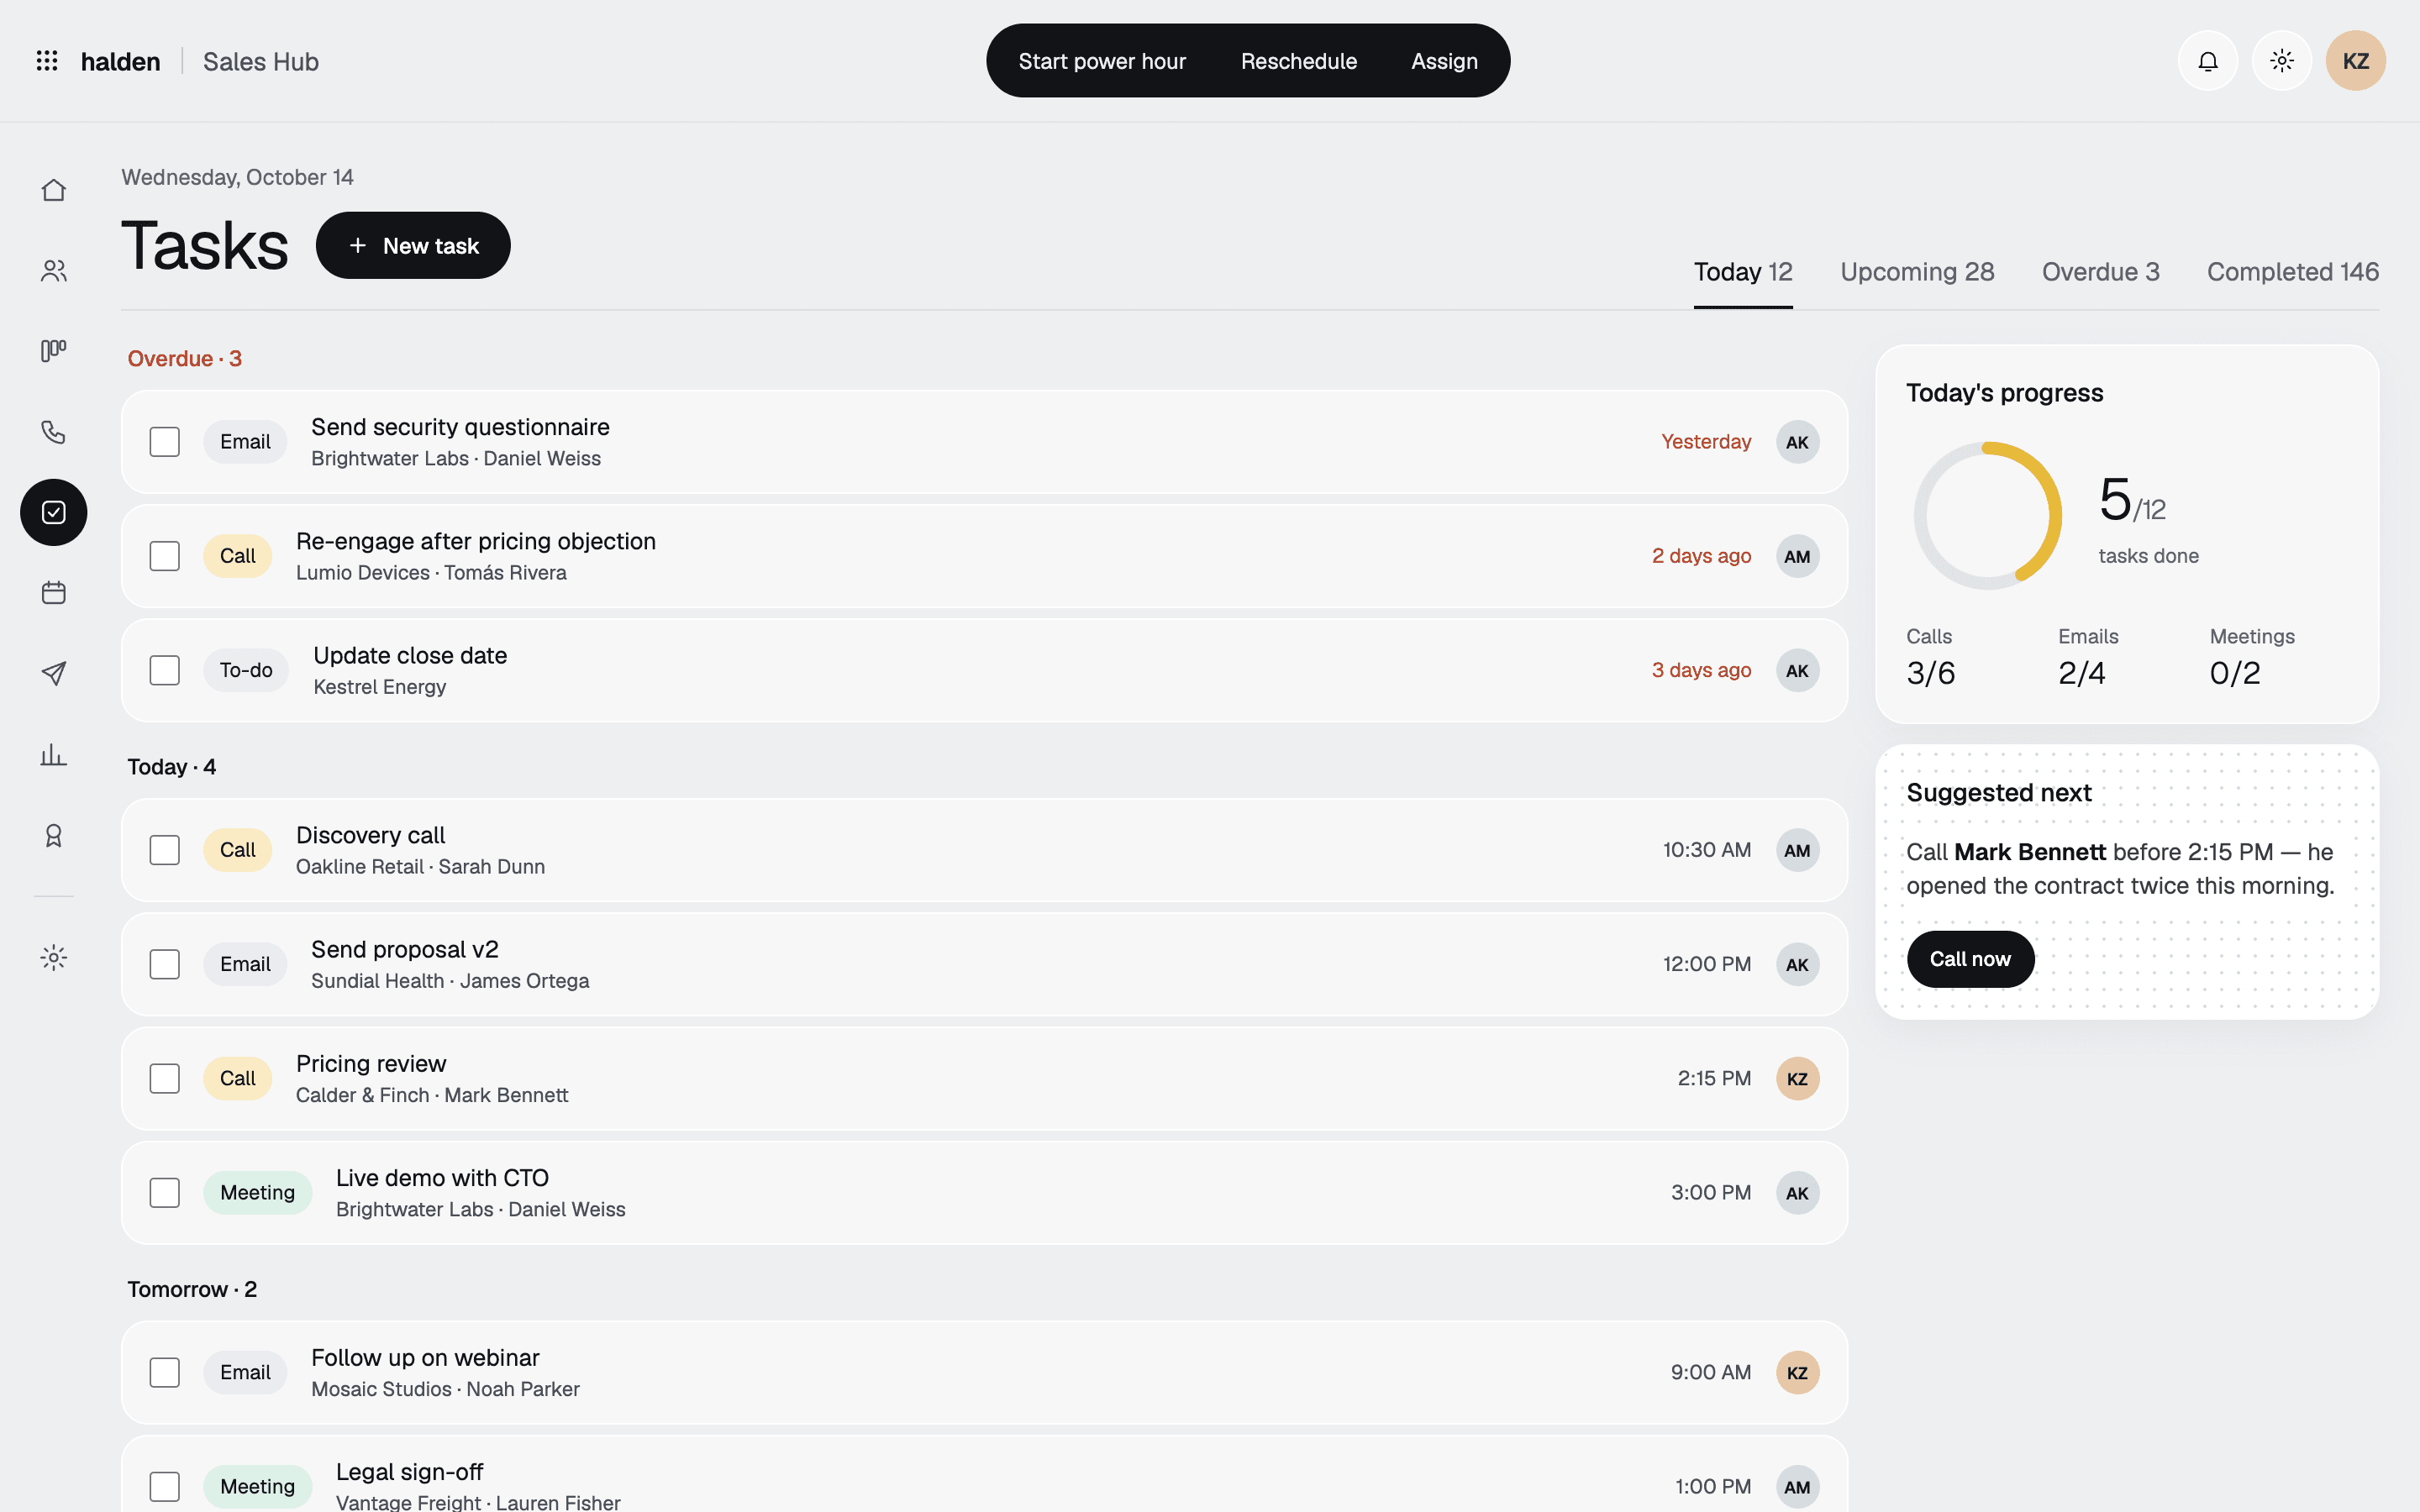
TasksOverdue, today, and tomorrow, with a suggested next call. 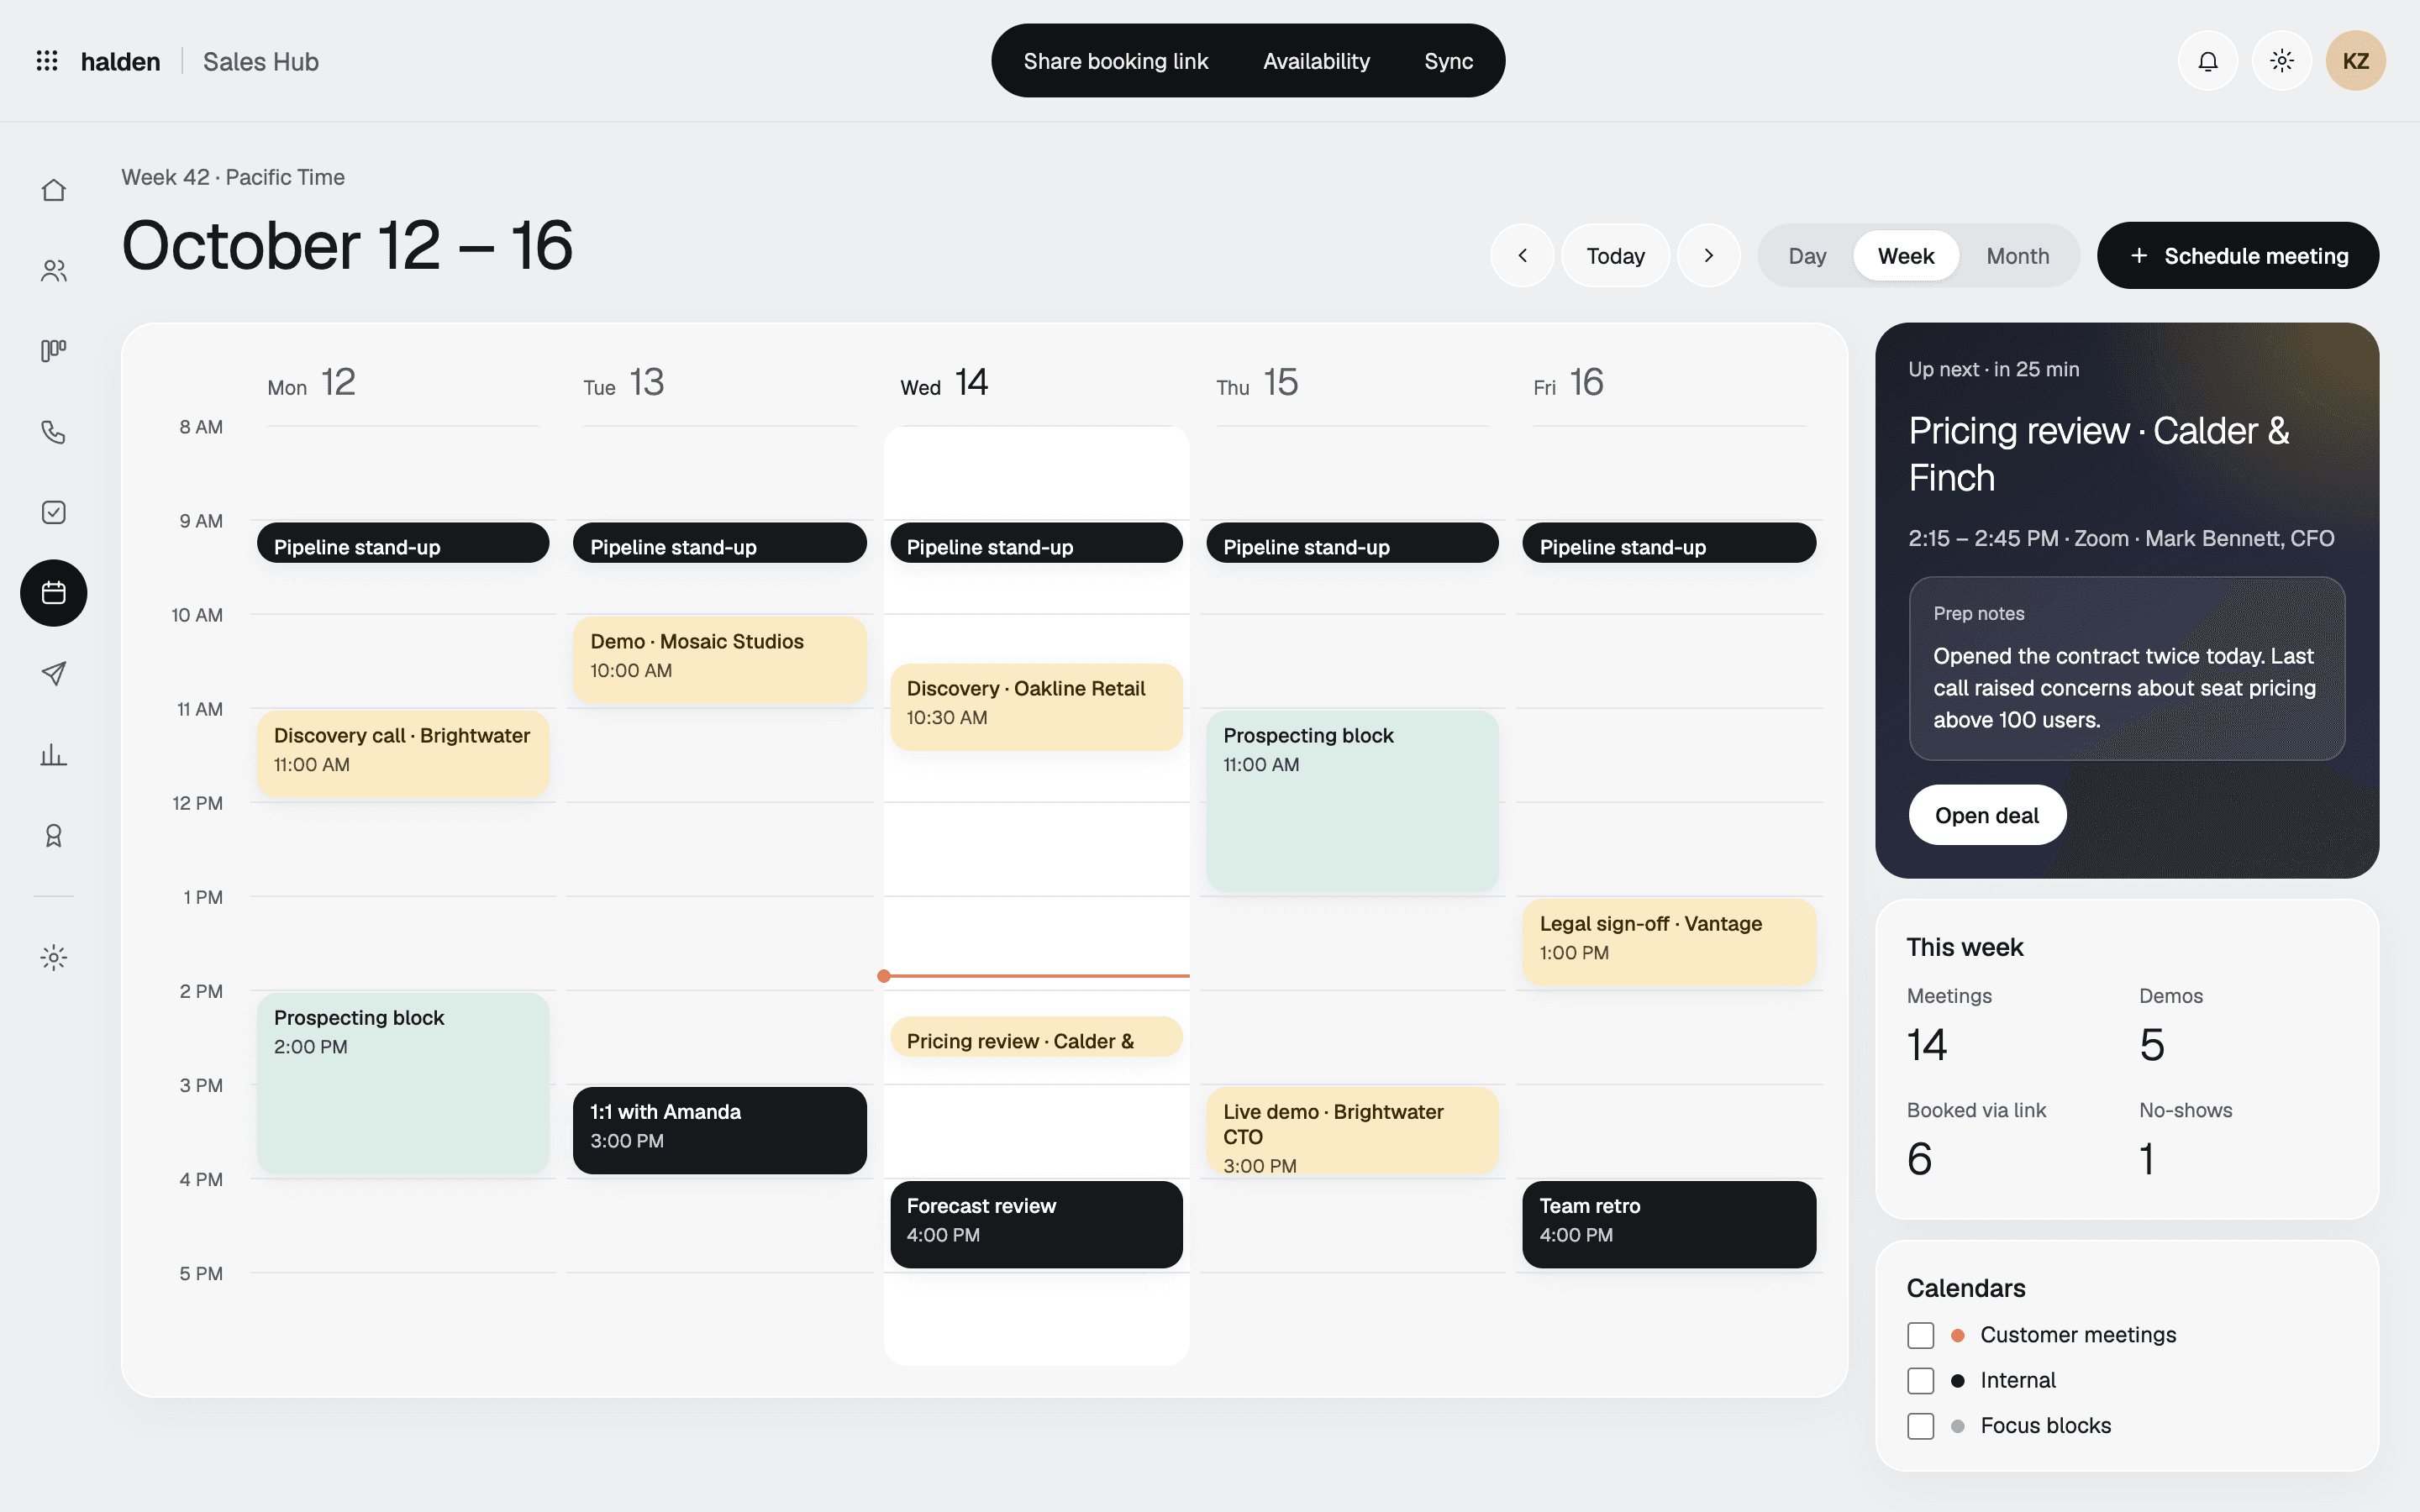
CalendarThe week's meetings, with the next one pinned.
Prospects, deals, and calls
The problemWhat the team knows about a deal is spread across inboxes, call recordings, and people's heads.
What we did
- Prospects are sorted by lead score, with saved views for hot leads, follow-ups, and unassigned prospects.
- A prospect page puts the whole deal on one screen: stage, value, win probability, contacts and their roles, competitors, and next steps.
- Call insights show talk-to-listen ratio, pace, topics, competitors, and action items next to a searchable transcript.
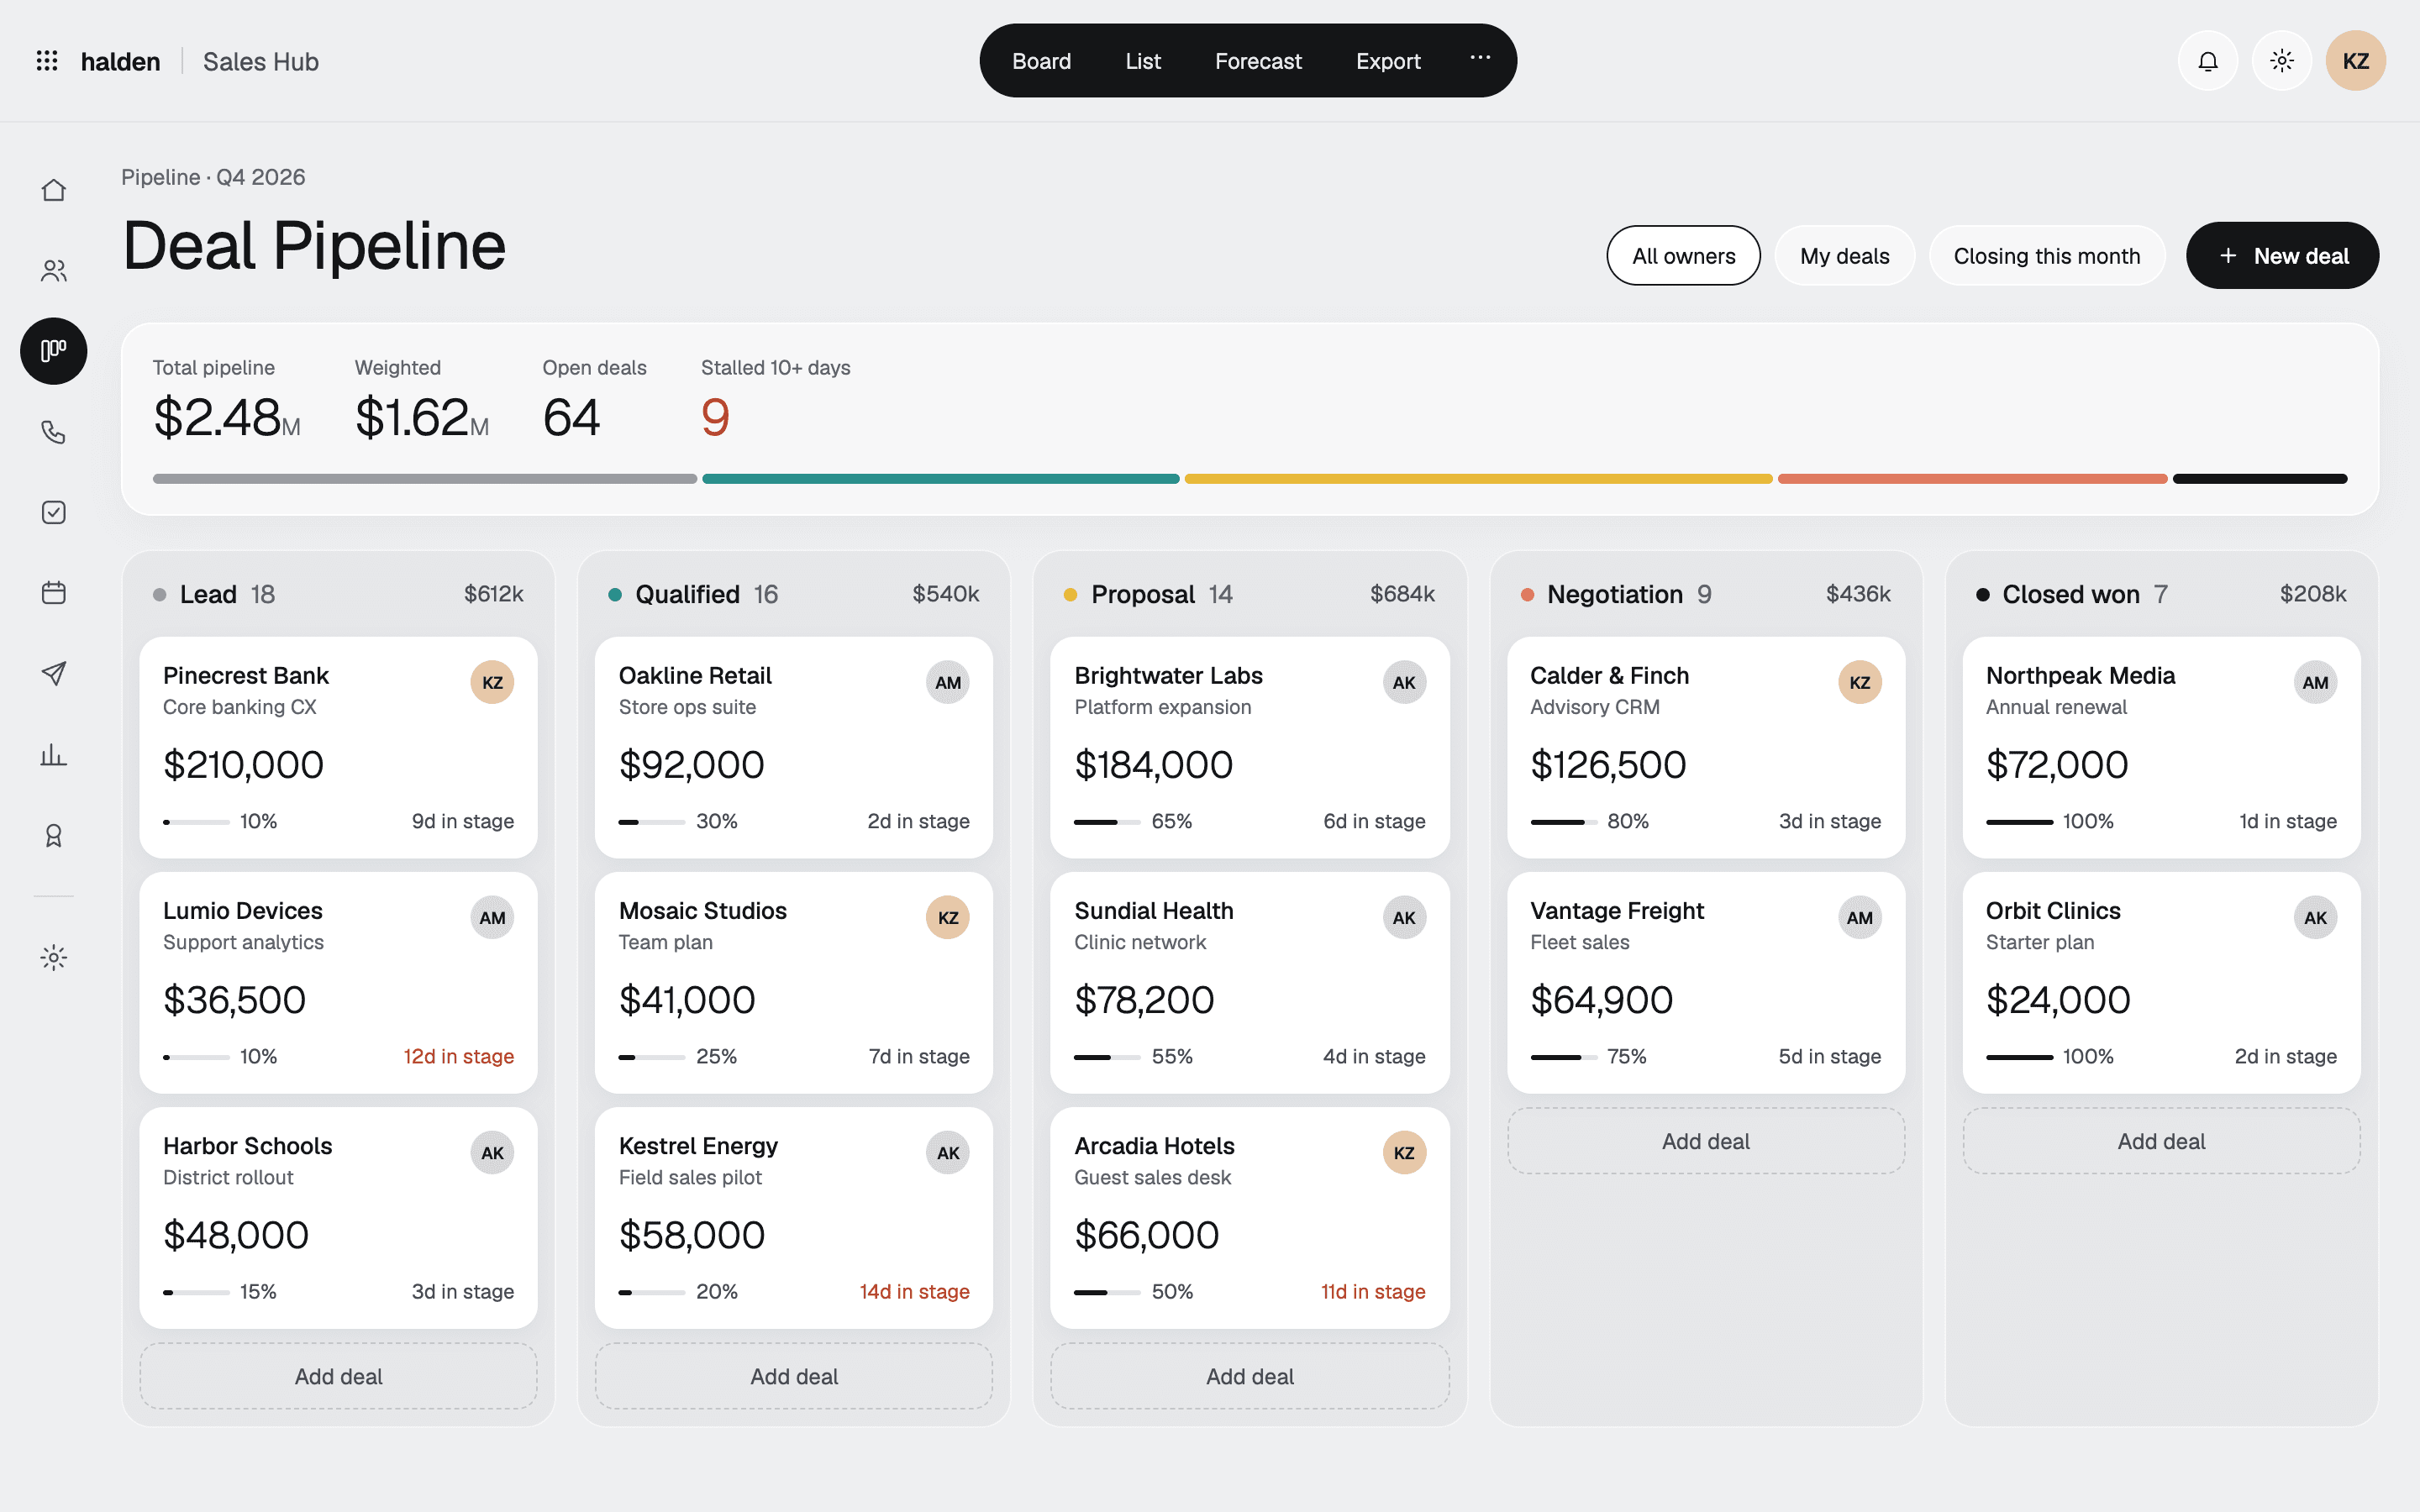
- The pipeline board shows how long each deal has sat in its stage and flags the ones that have stalled.
- Adding a prospect checks for duplicates first and can enroll them in a sequence when saved.
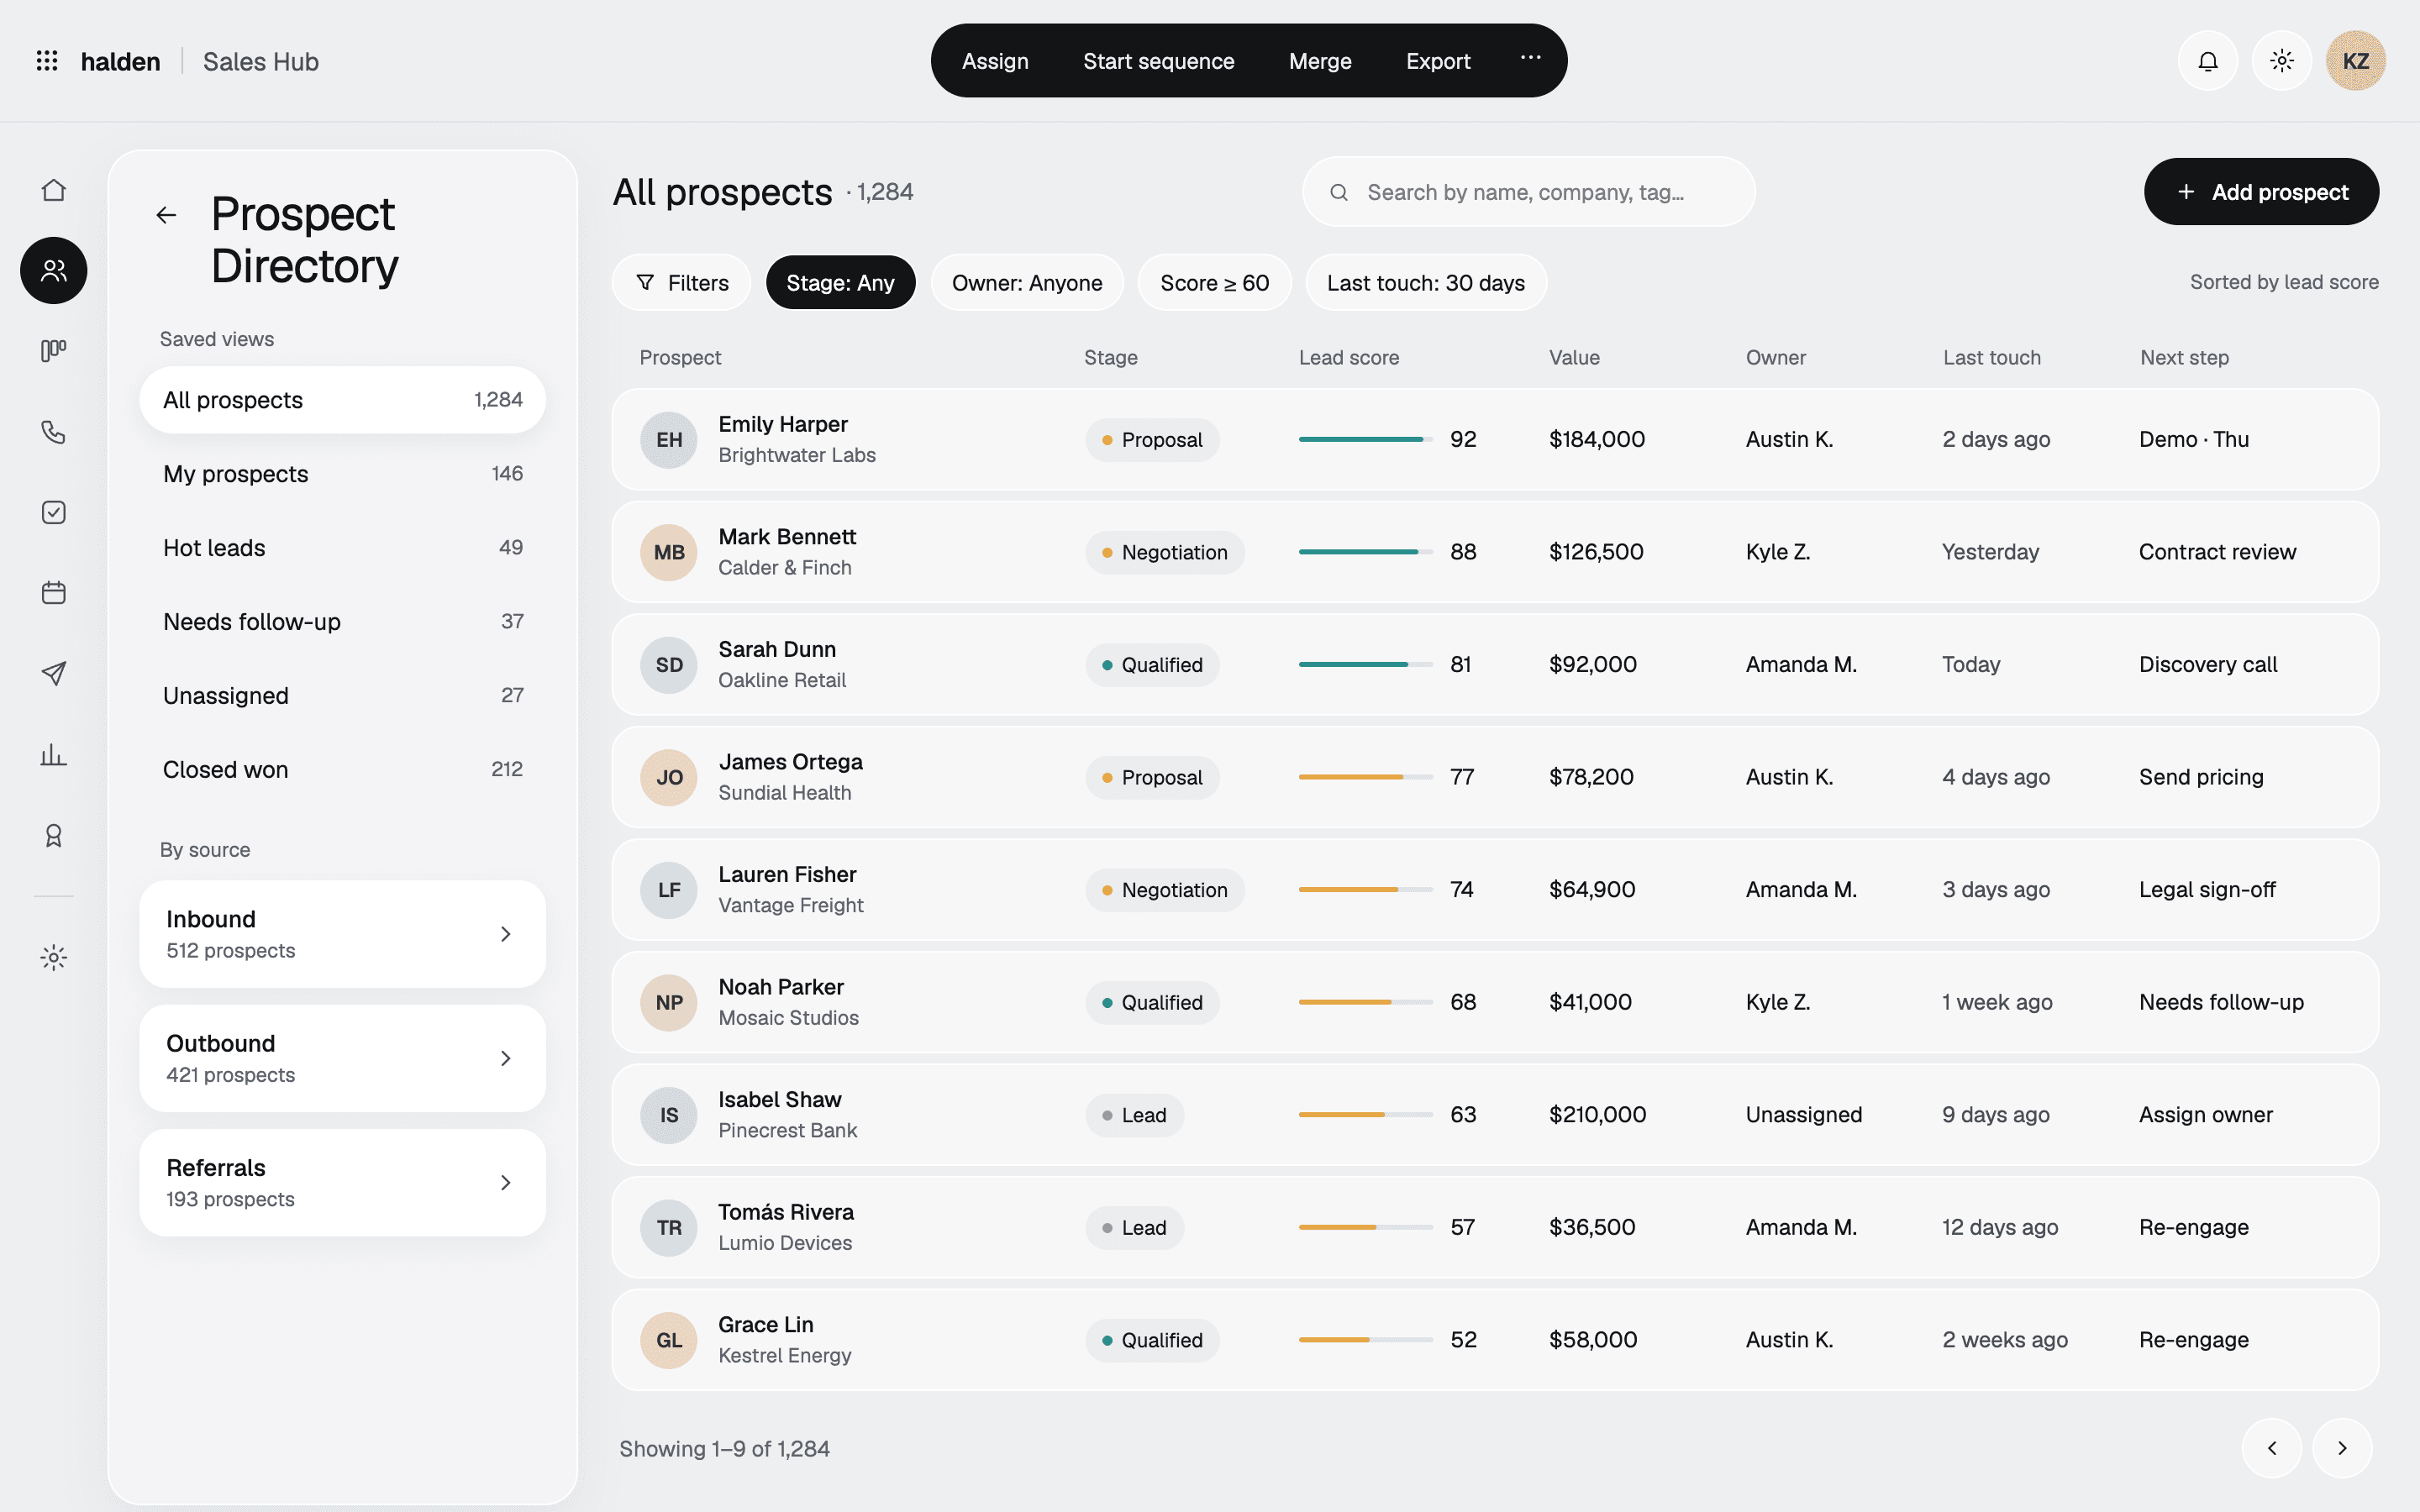
ProspectsSaved views, filters, and lead scores. 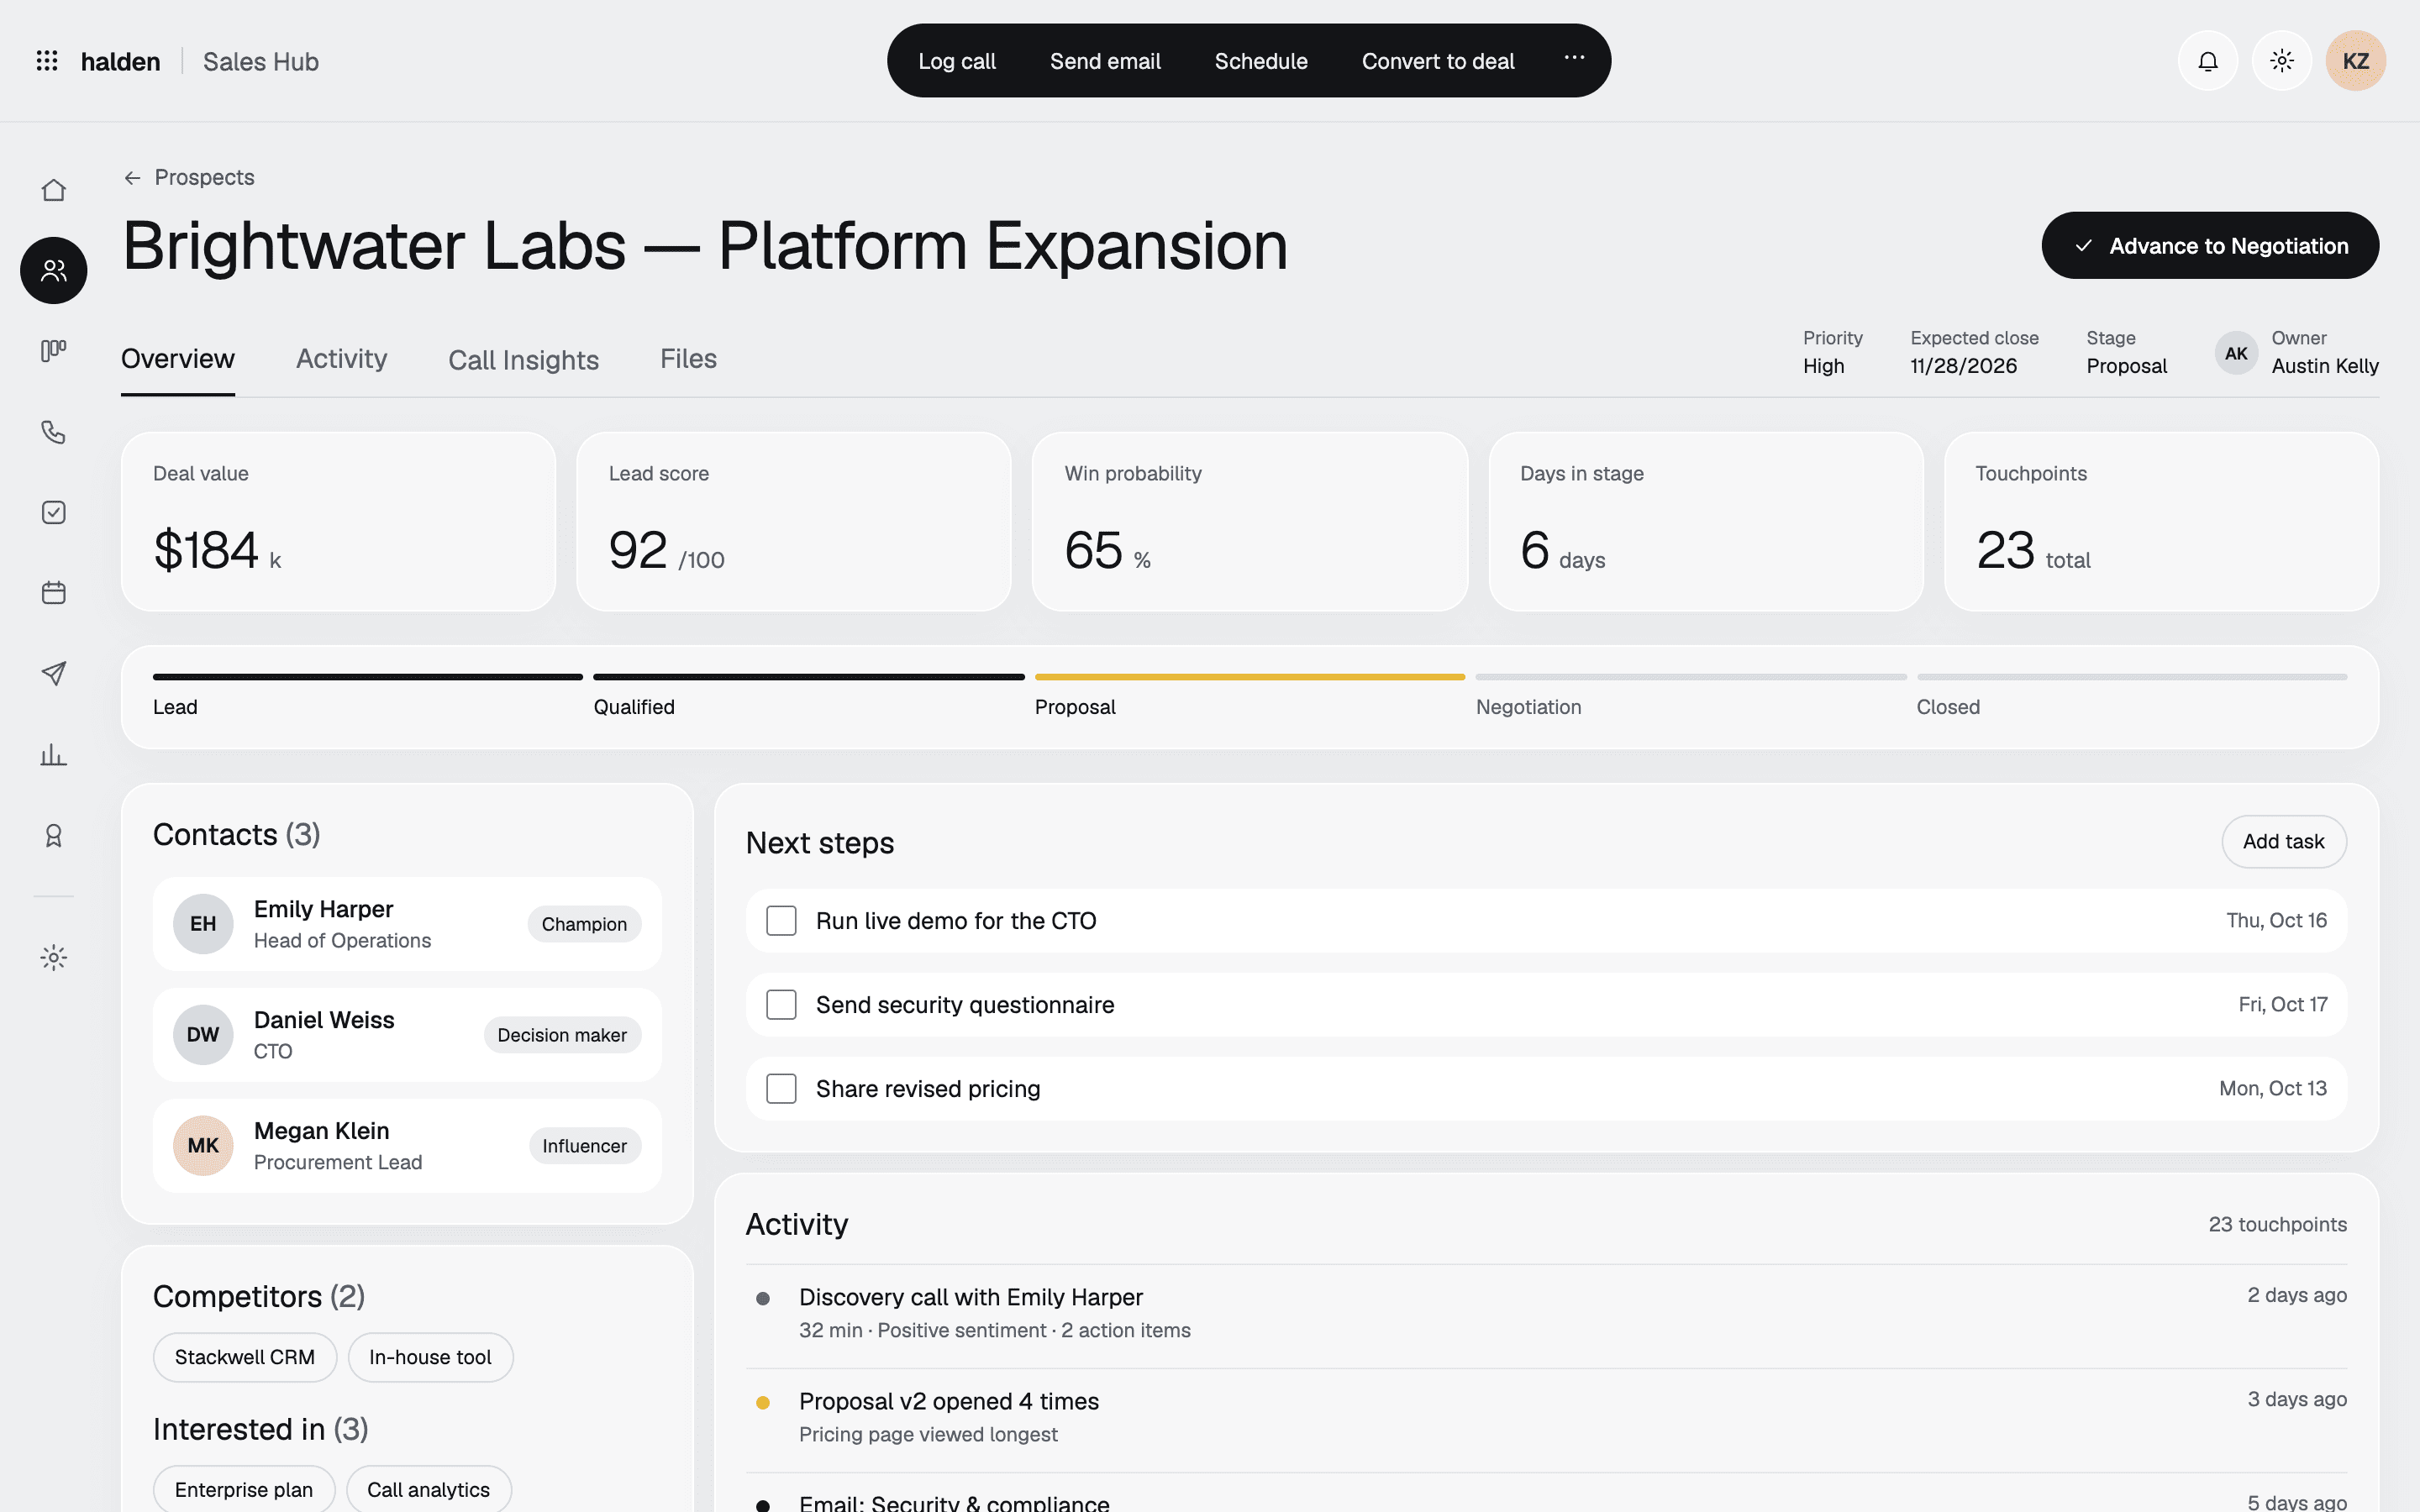
Prospect detailThe whole deal on one screen. Call insightsTalk ratio, topics, competitors, and action items. PipelineStages, values, and stalled deals. 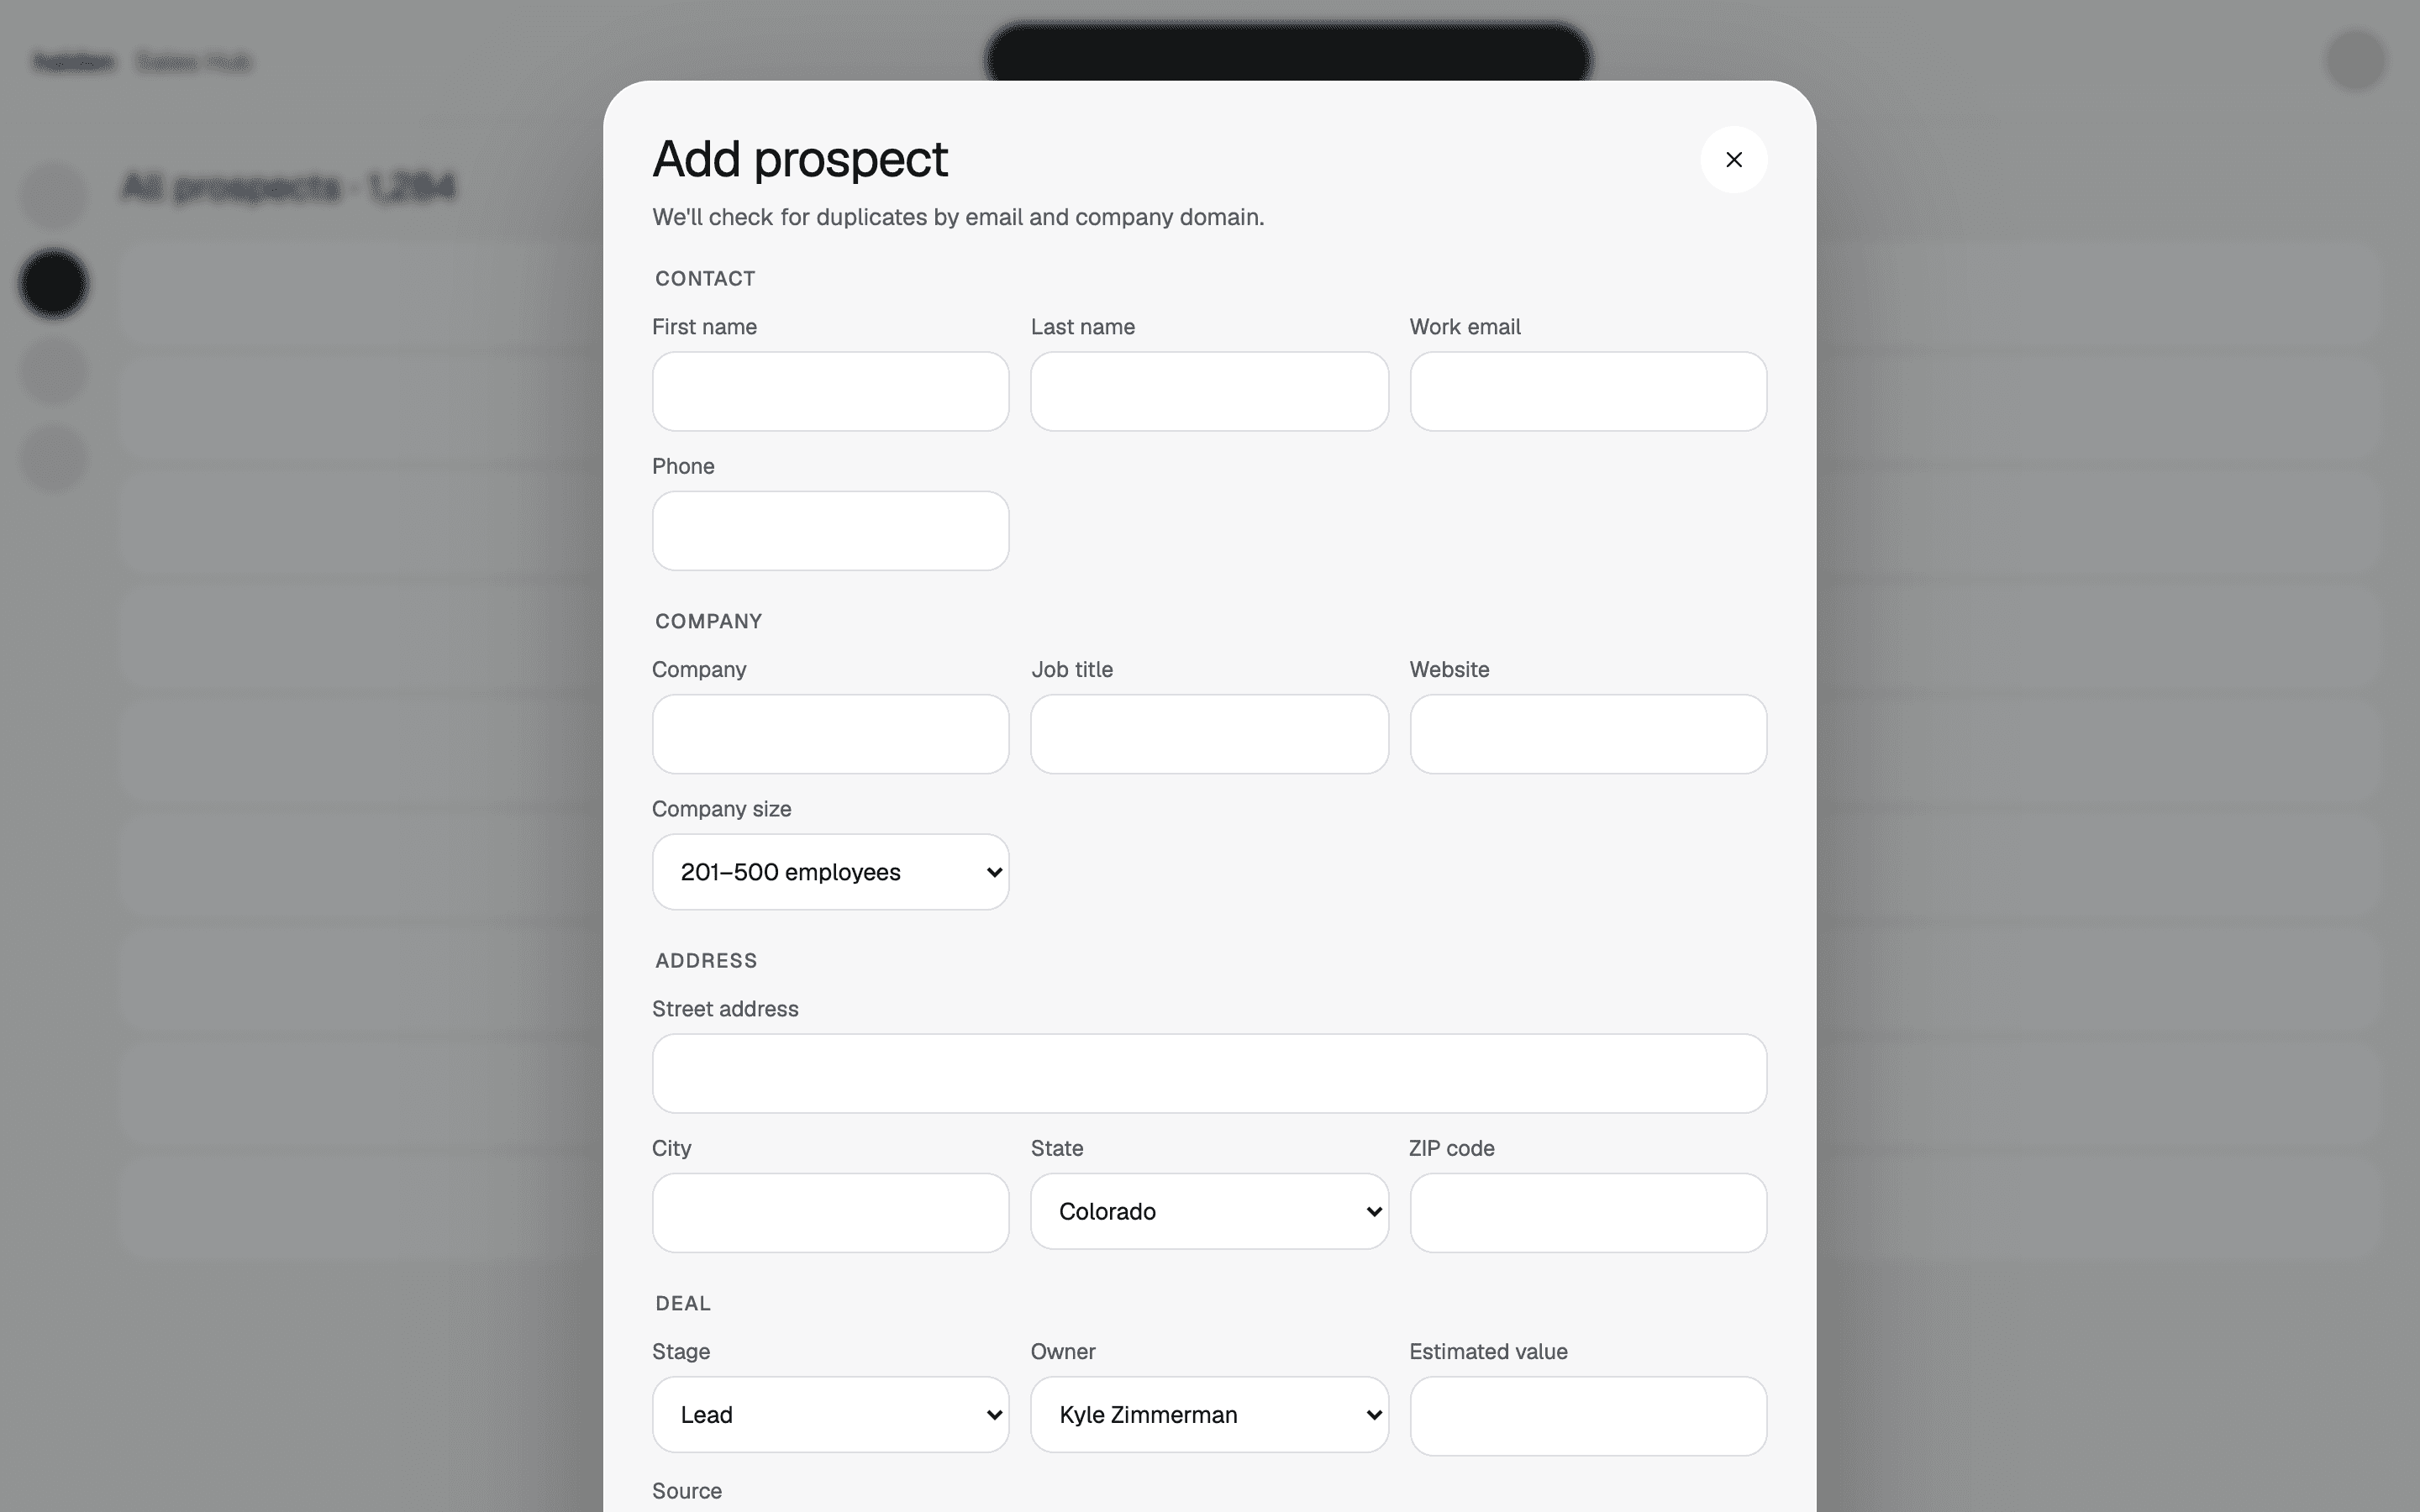
Add prospectChecks for duplicates, enrolls in a sequence.
Sequences, reports, and coaching
The problemManagers can see who closed, but not why, so coaching comes down to guesswork.
What we did
- Sequences mix automatic emails with manual calls and show opens and replies for each step. A weak step stands out.
- The forecast stacks closed, commit, best case, and pipeline against the target, with the days left in the quarter.
- Reports show win rate by source, conversion between stages, and why deals were lost.
- Team performance ranks reps by quota attainment, with win rate, calls, and cycle length alongside.
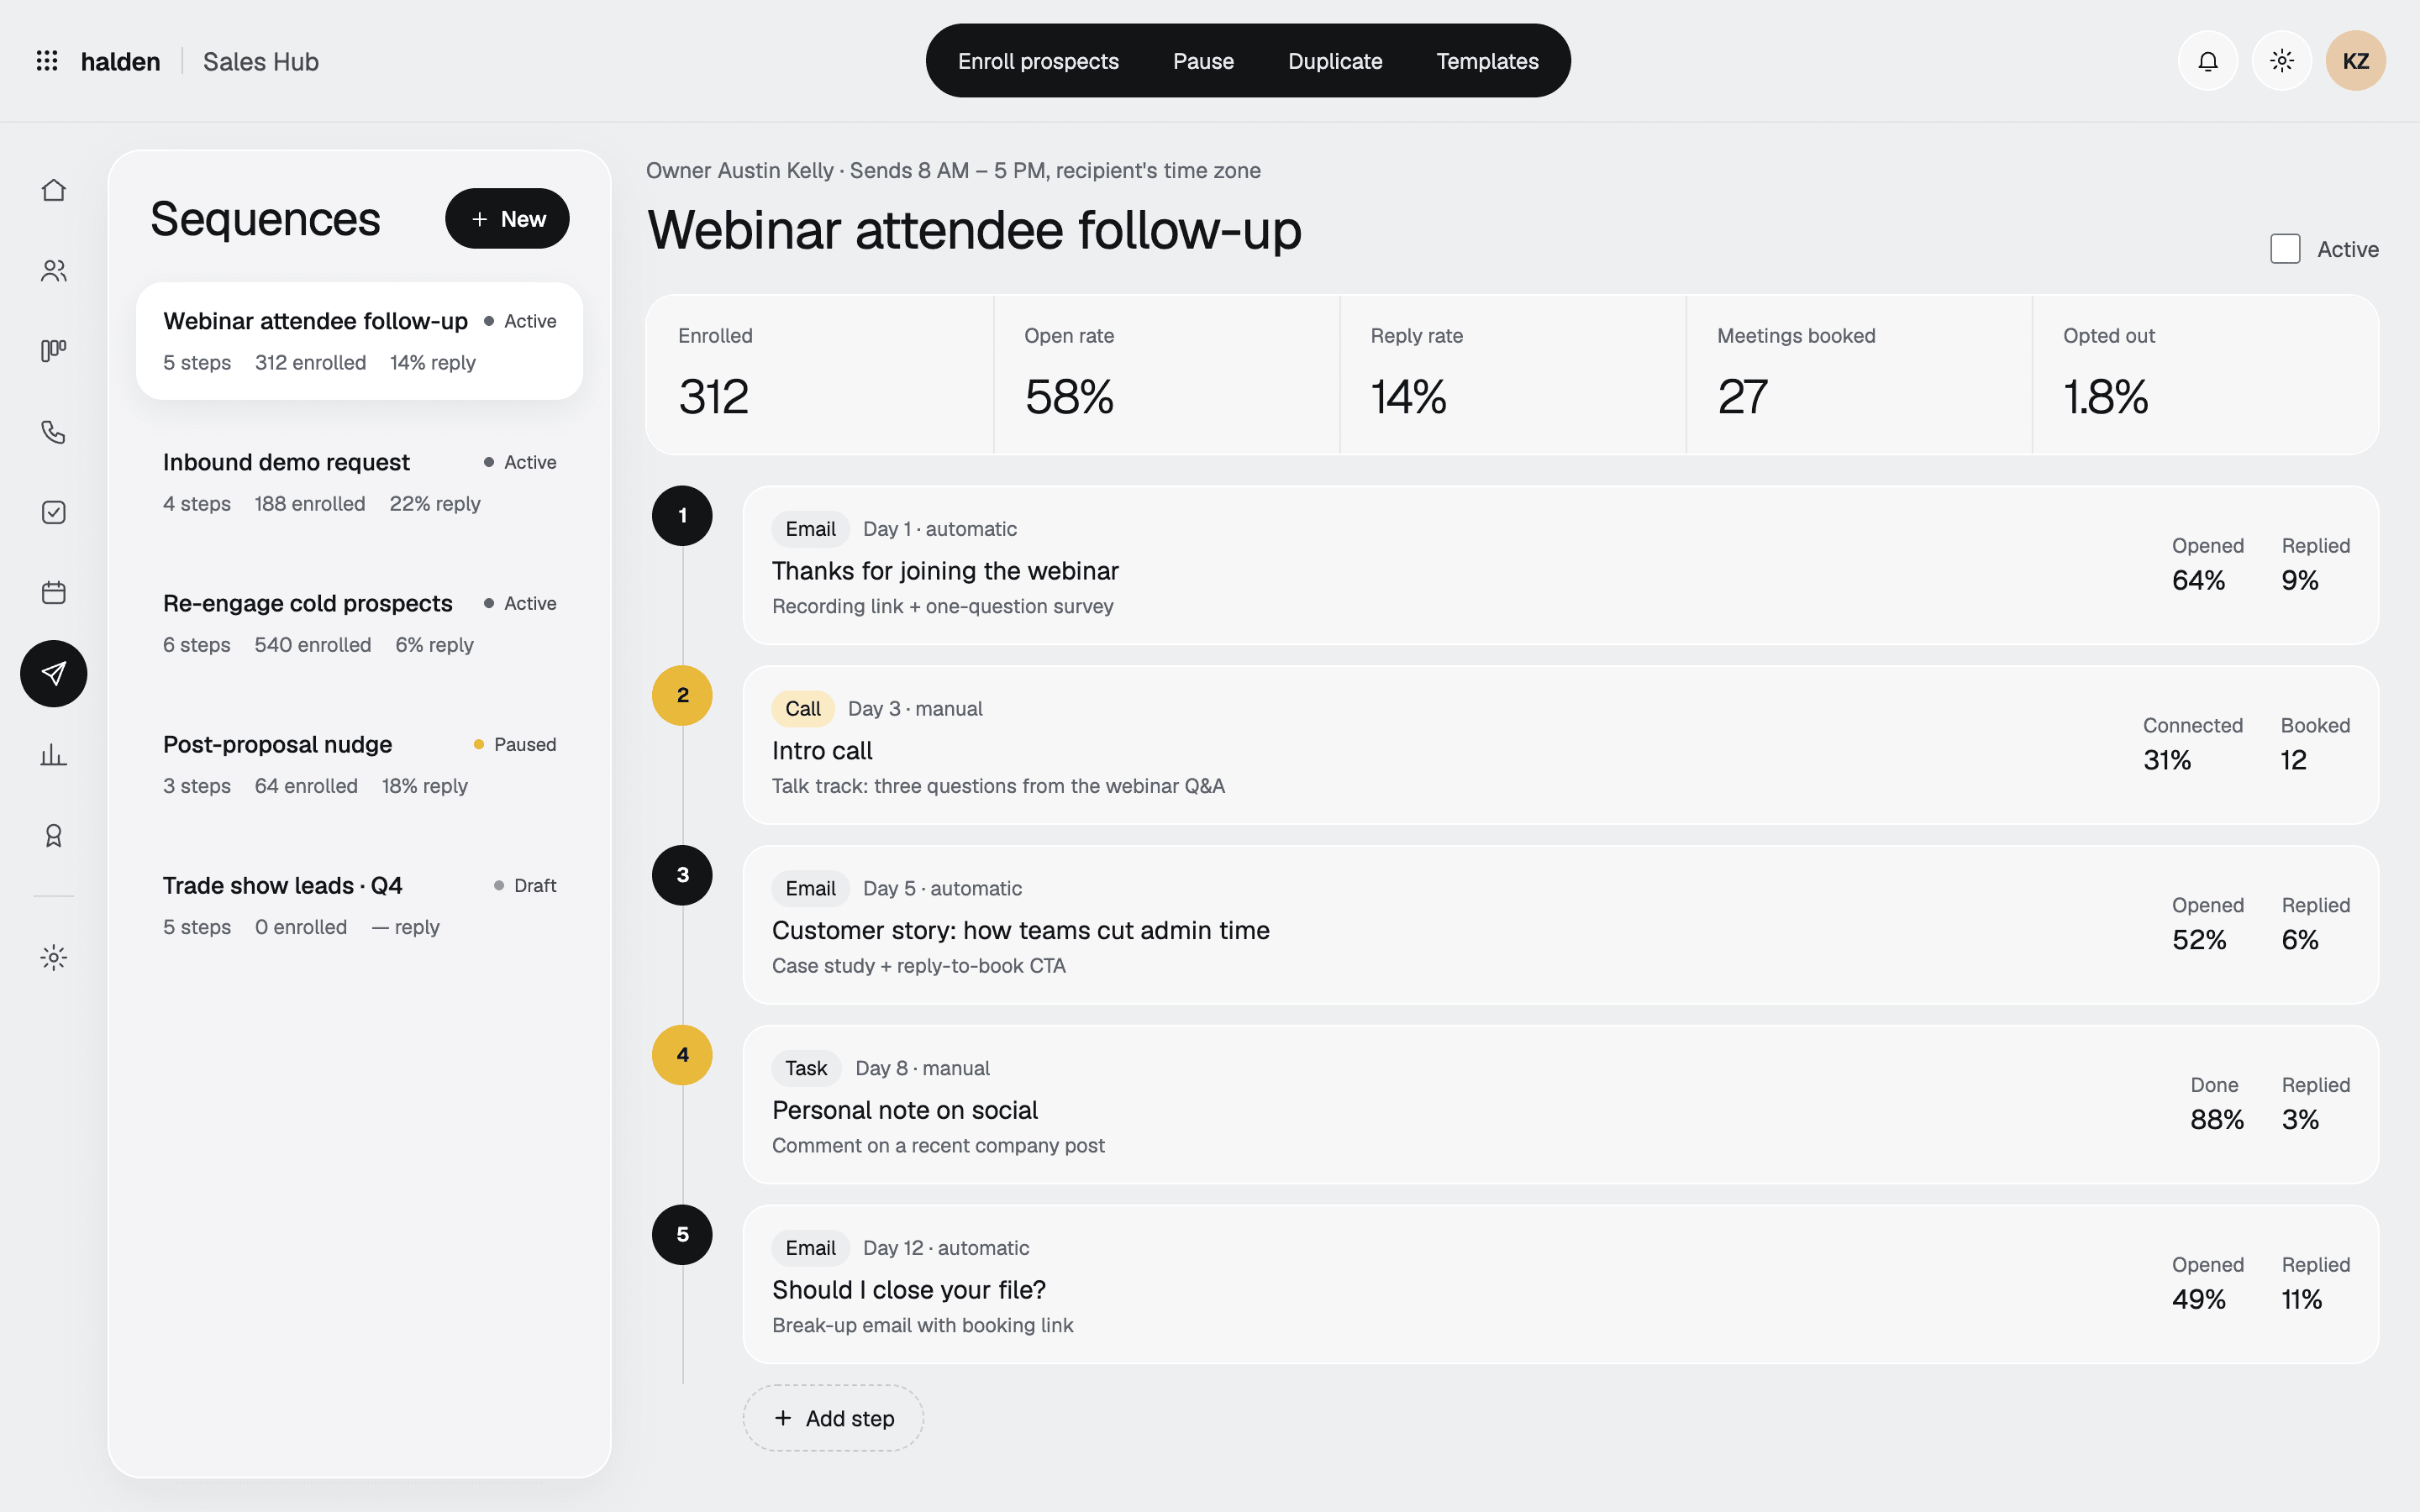
SequencesSteps, timing, and reply rates. 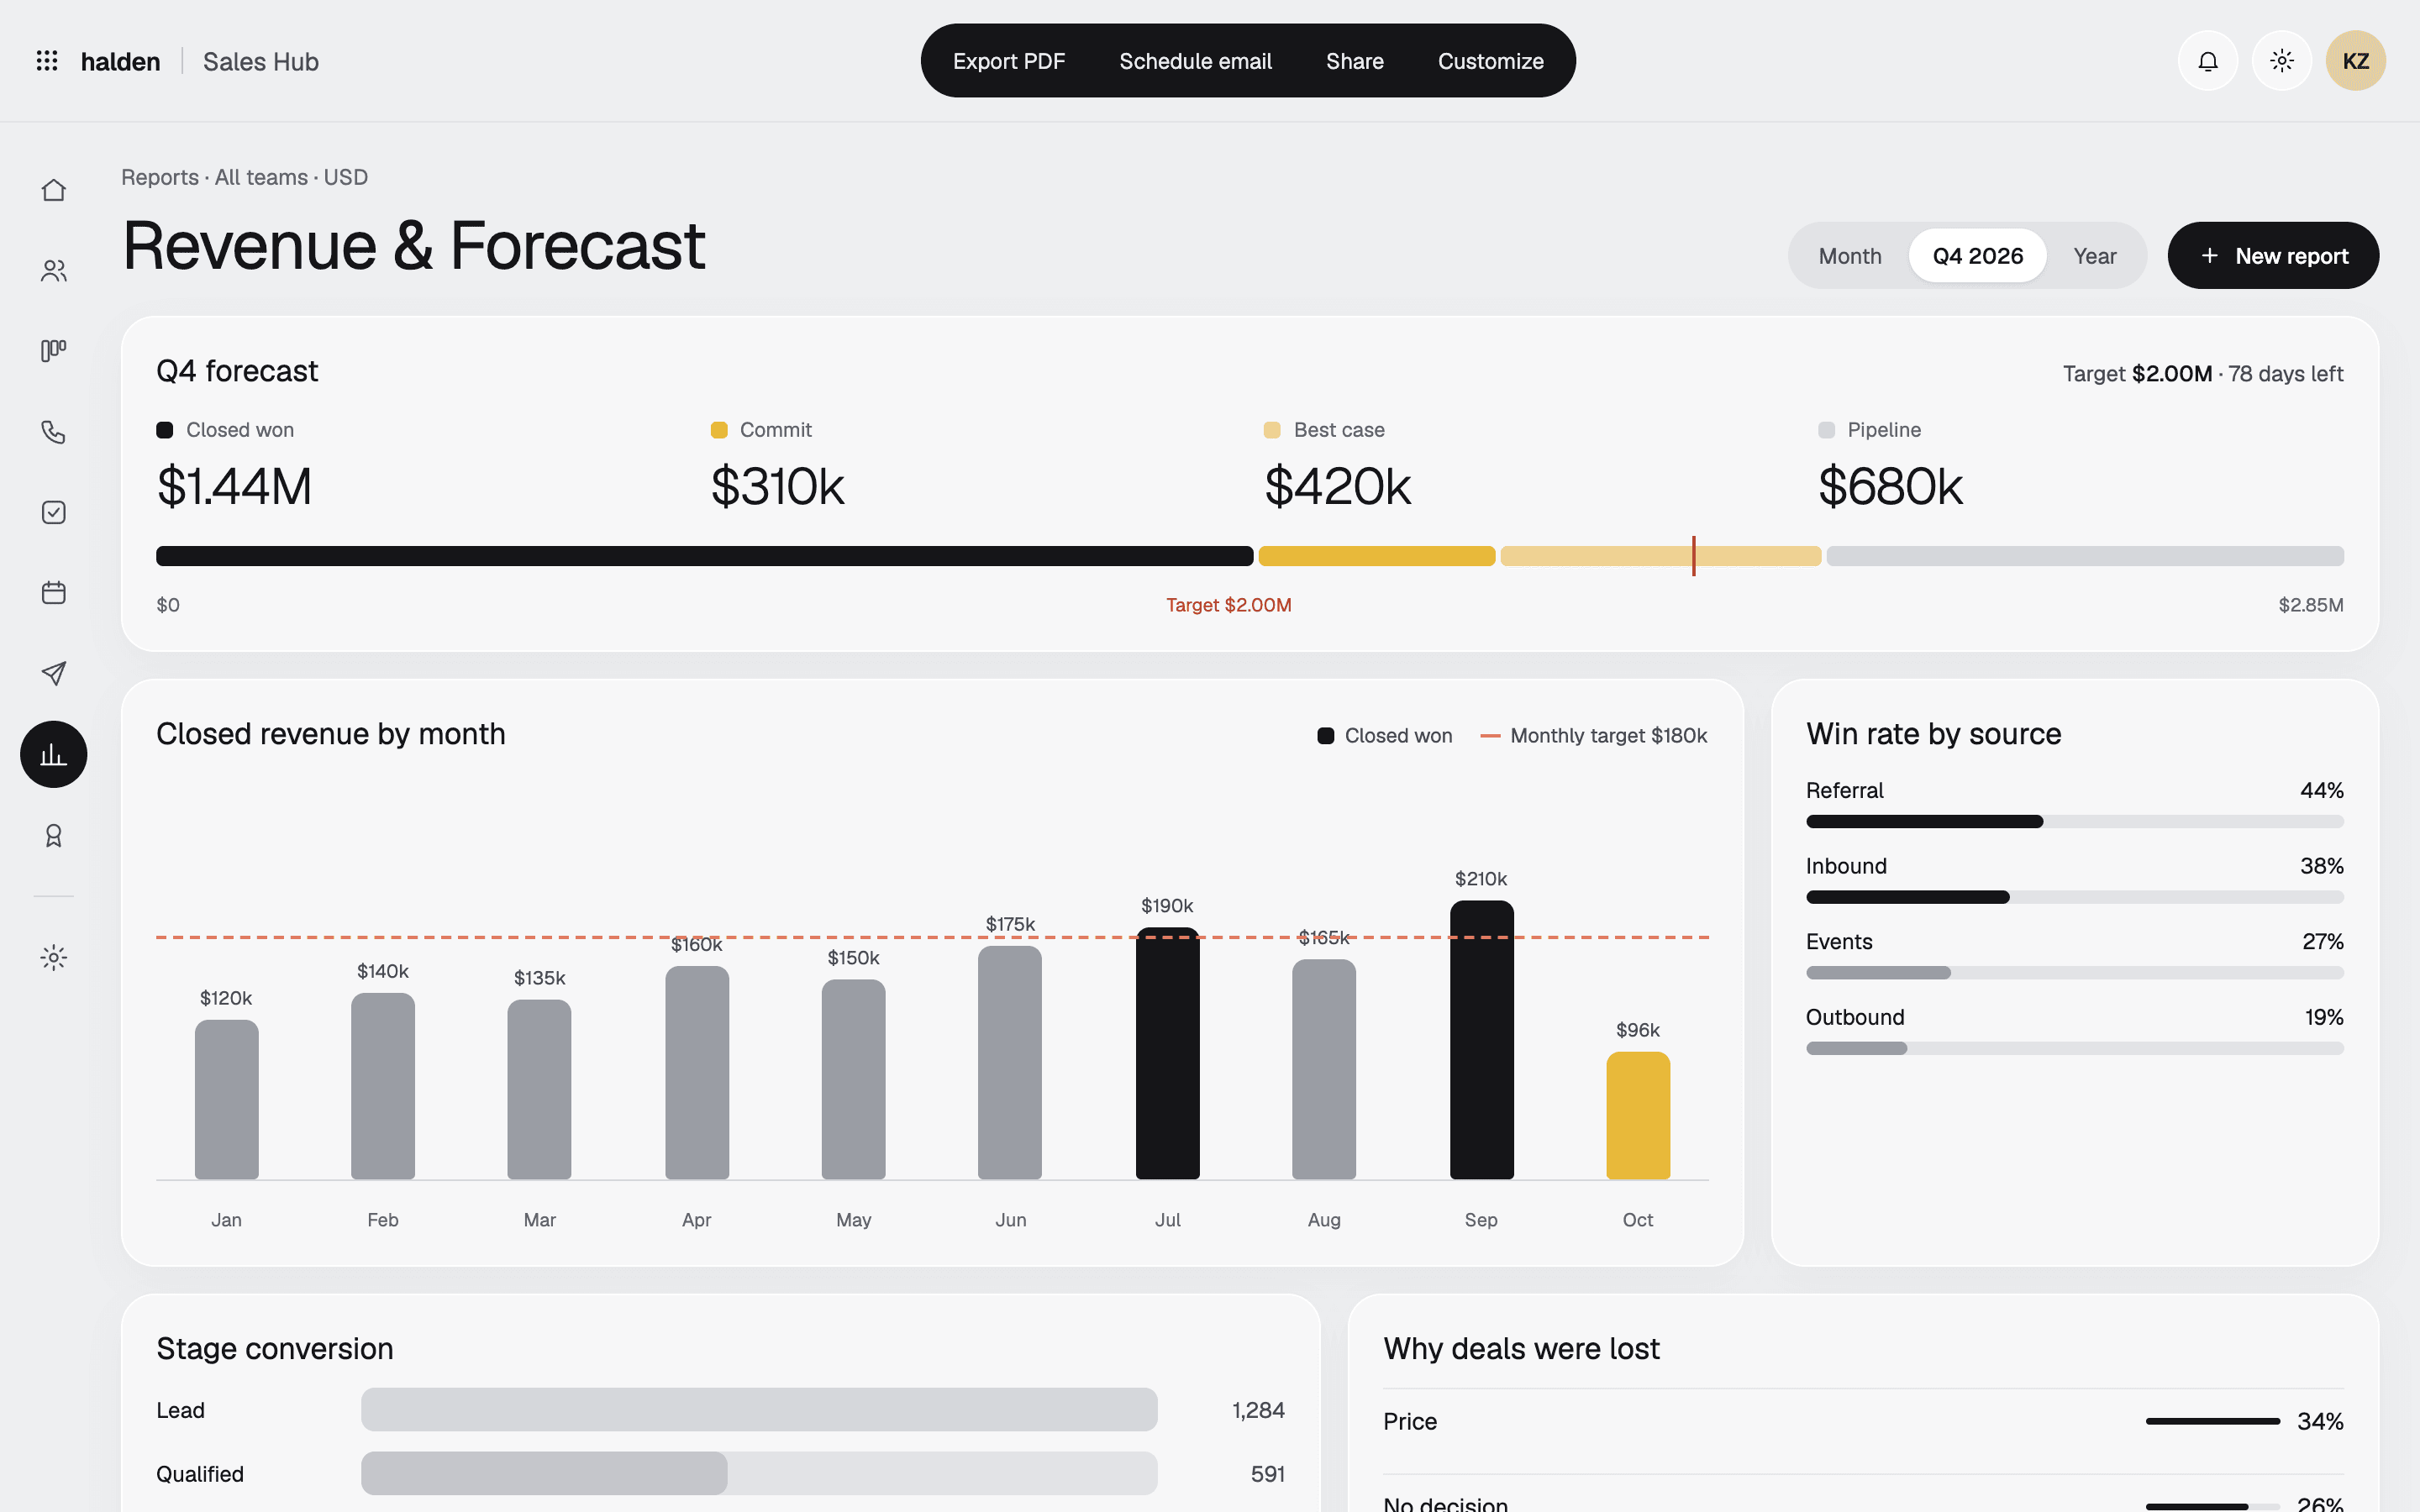
Revenue and forecastForecast, closed revenue, and lost reasons. 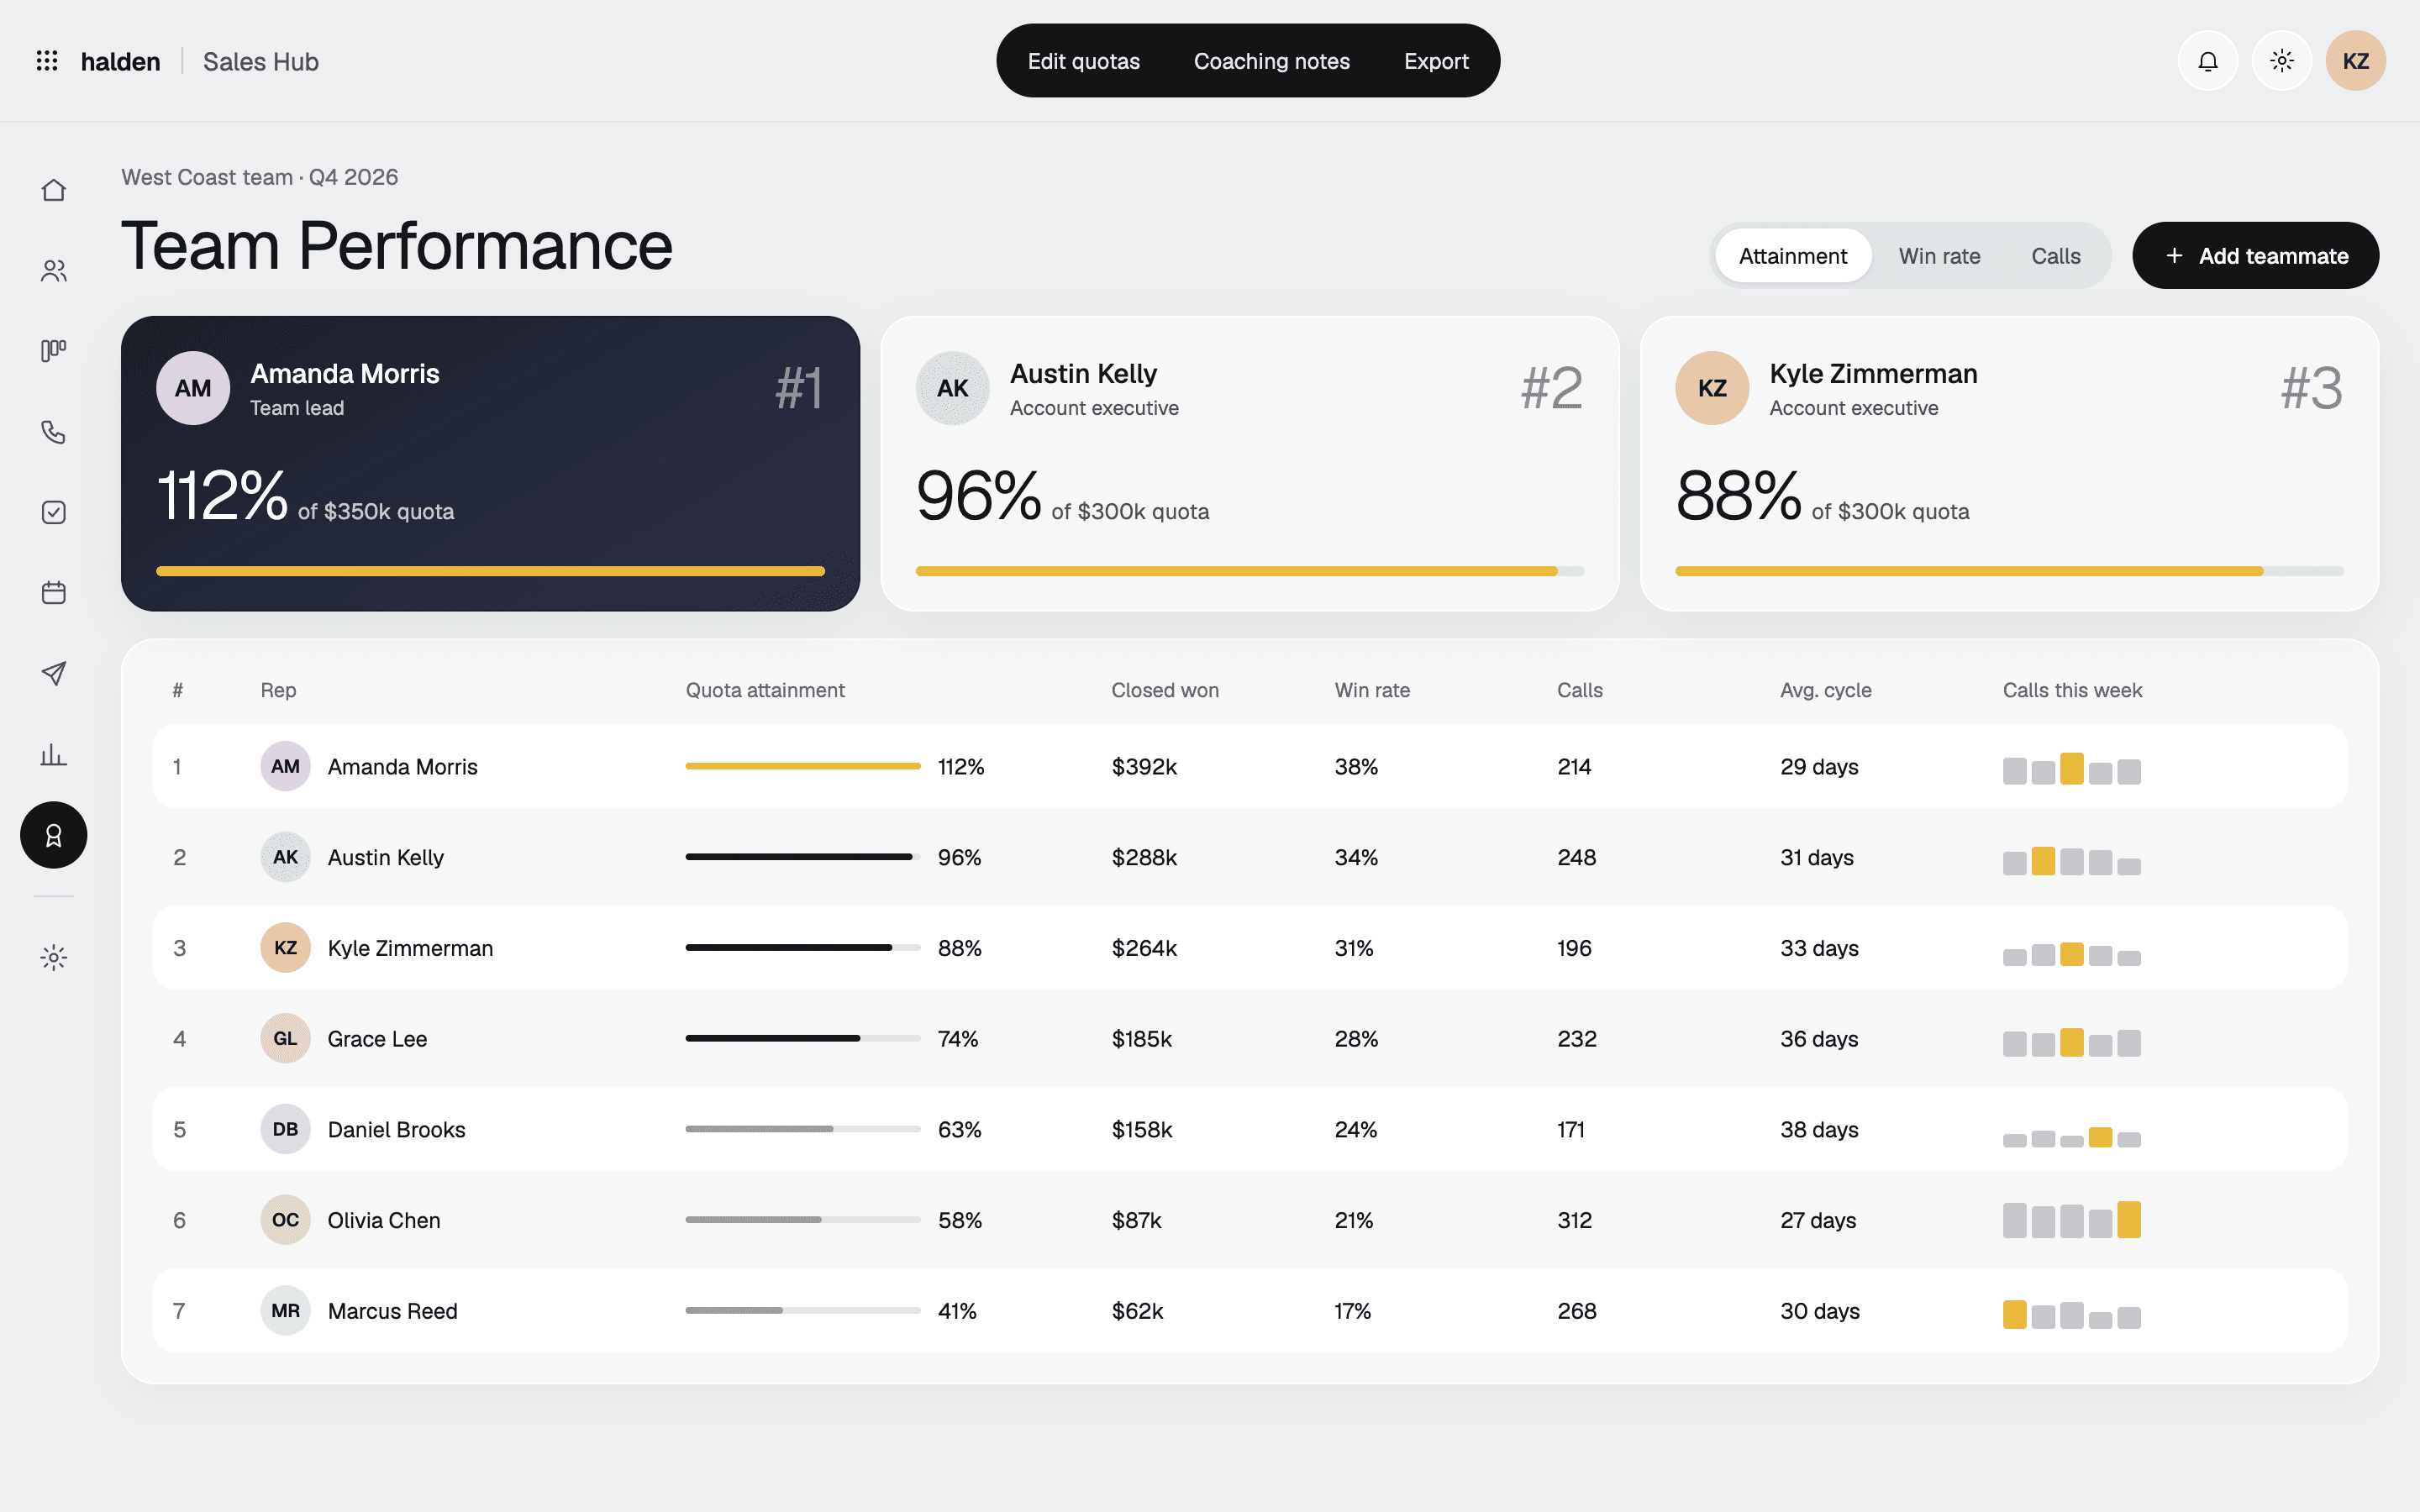
Team performanceAttainment, win rate, and calls per rep.
Admin settings
The problemSettings in most CRMs change things without saying what they affect.
What we did
- Each pipeline stage has a win probability that feeds the weighted forecast, and a number of days before a deal counts as stalled.
- Reps have to pick a reason when they mark a deal lost. That one rule is what makes the lost-deals report possible.
- Roles, seats, and pending invites are on one screen, and each connected integration shows when it last synced.
- Billing shows usage against the plan's limits for call recording minutes, sequence emails, and AI summaries.
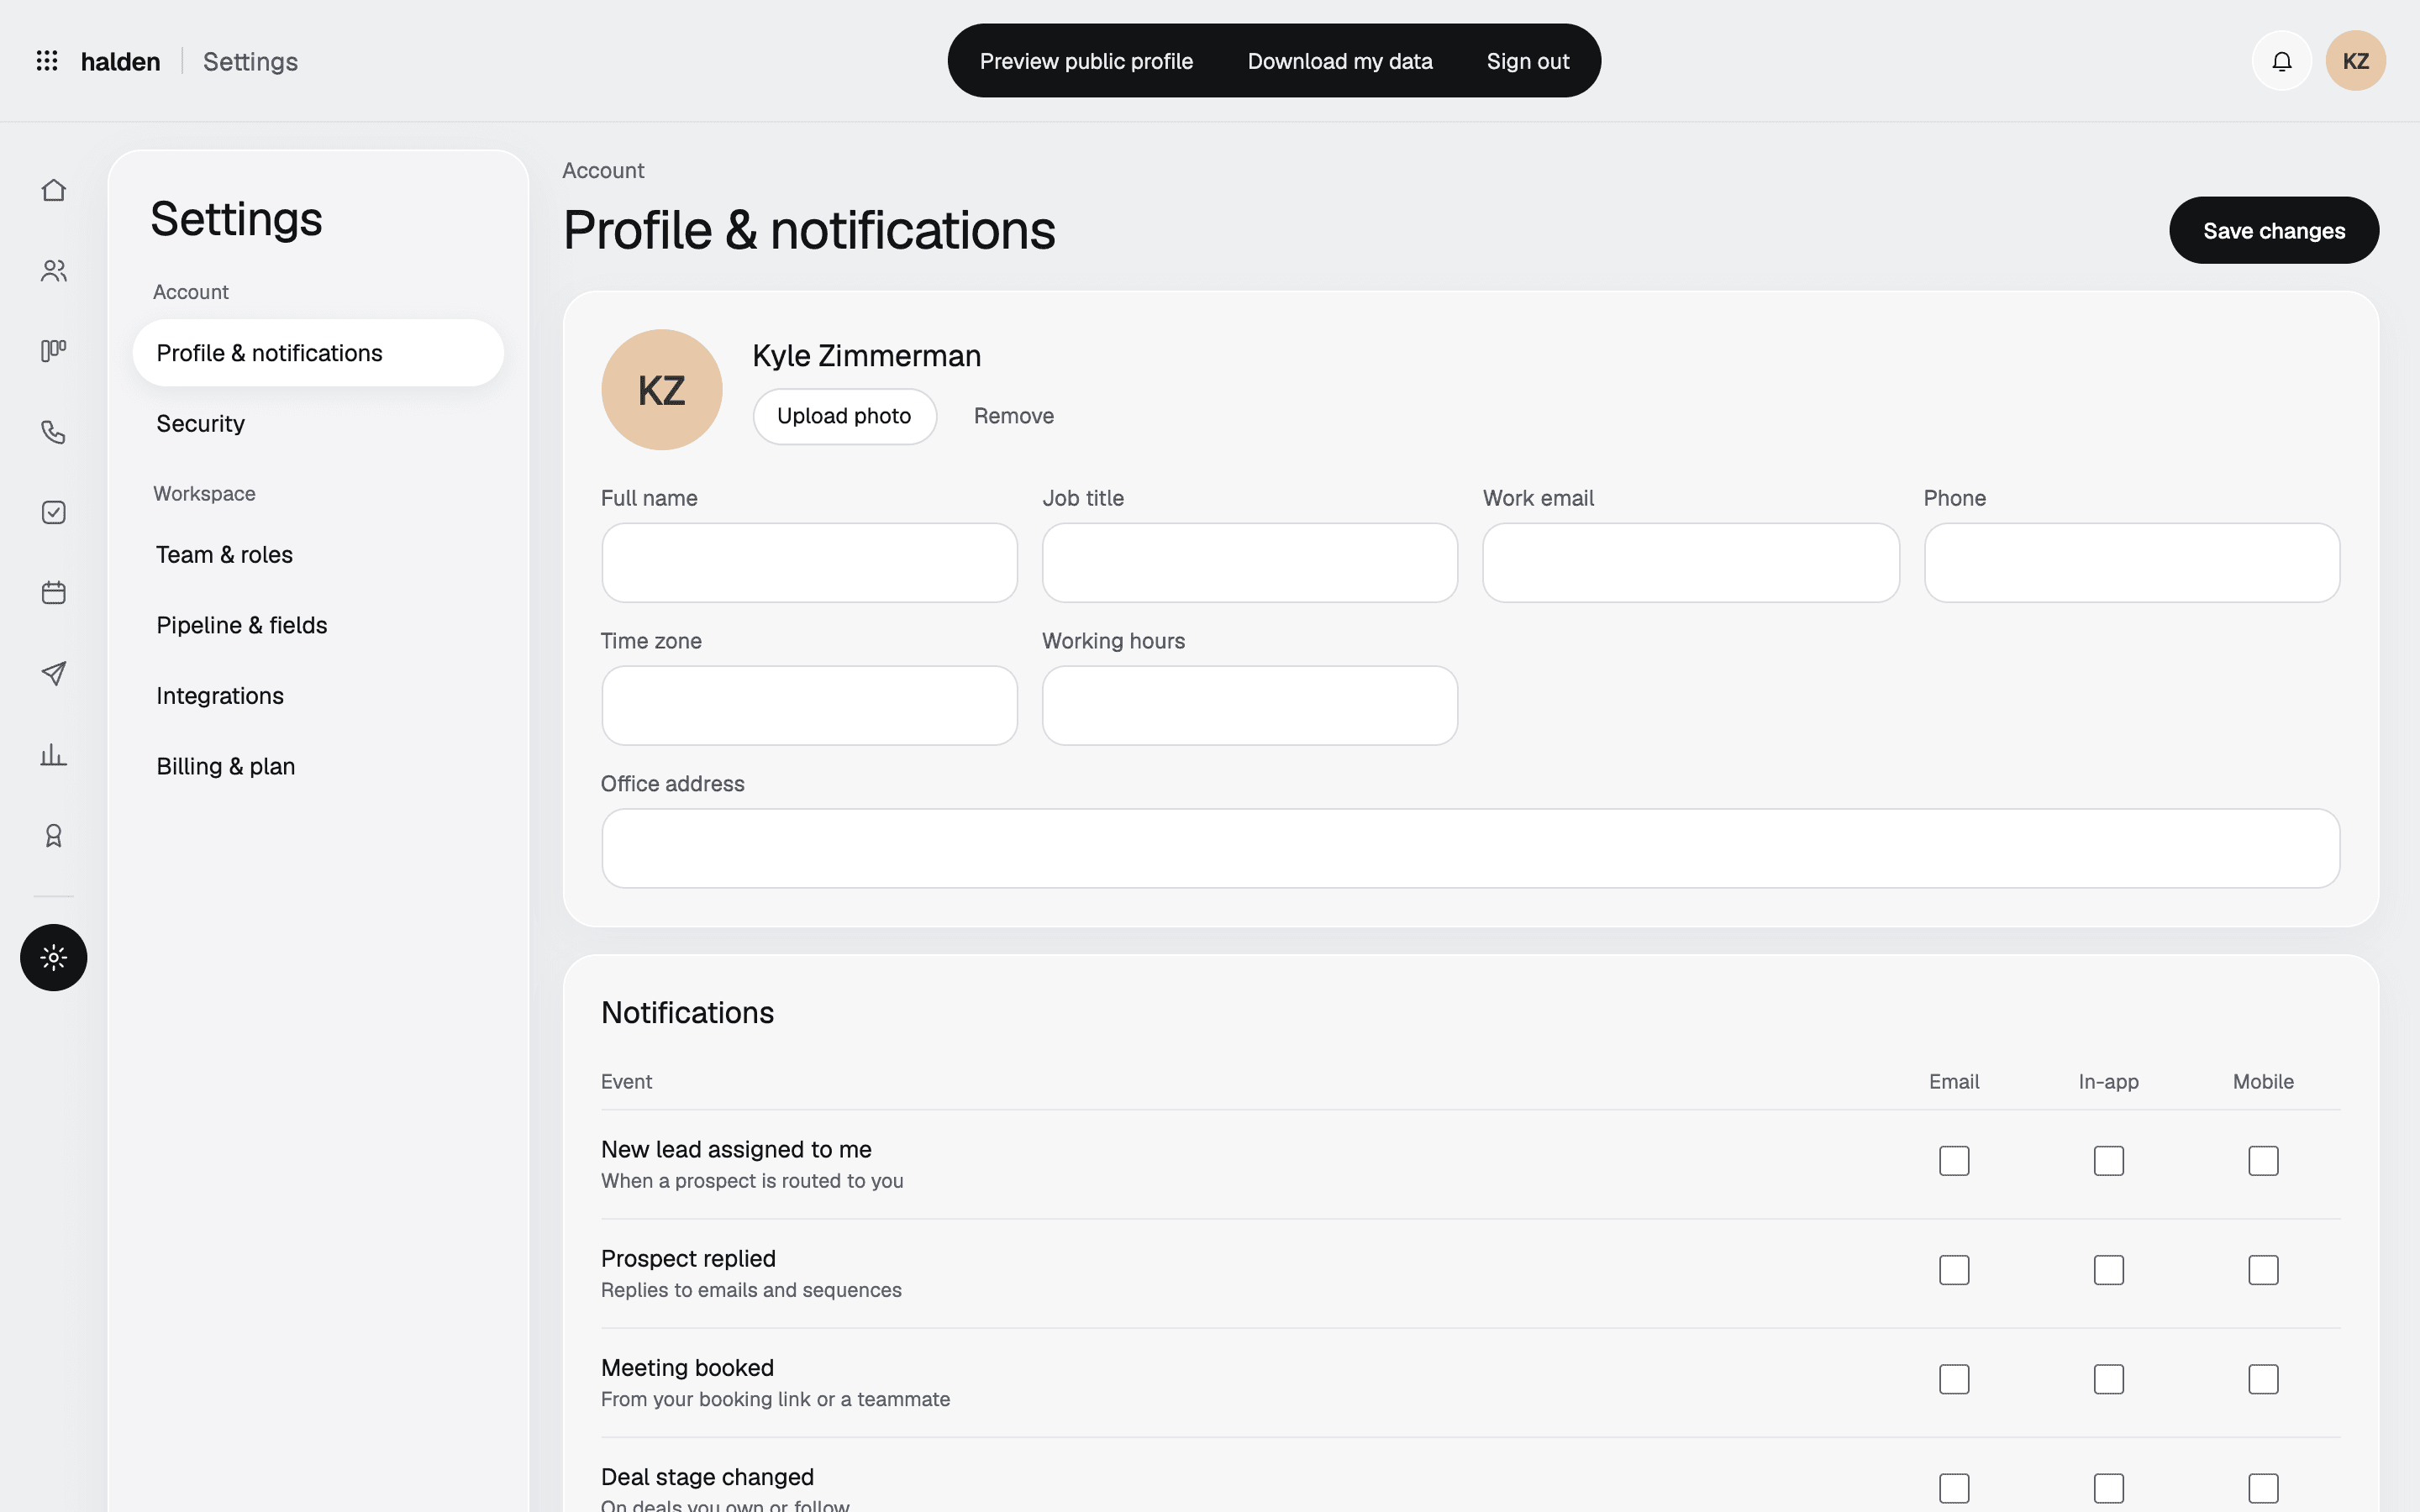
Profile and notificationsNotifications by event and channel, and security. 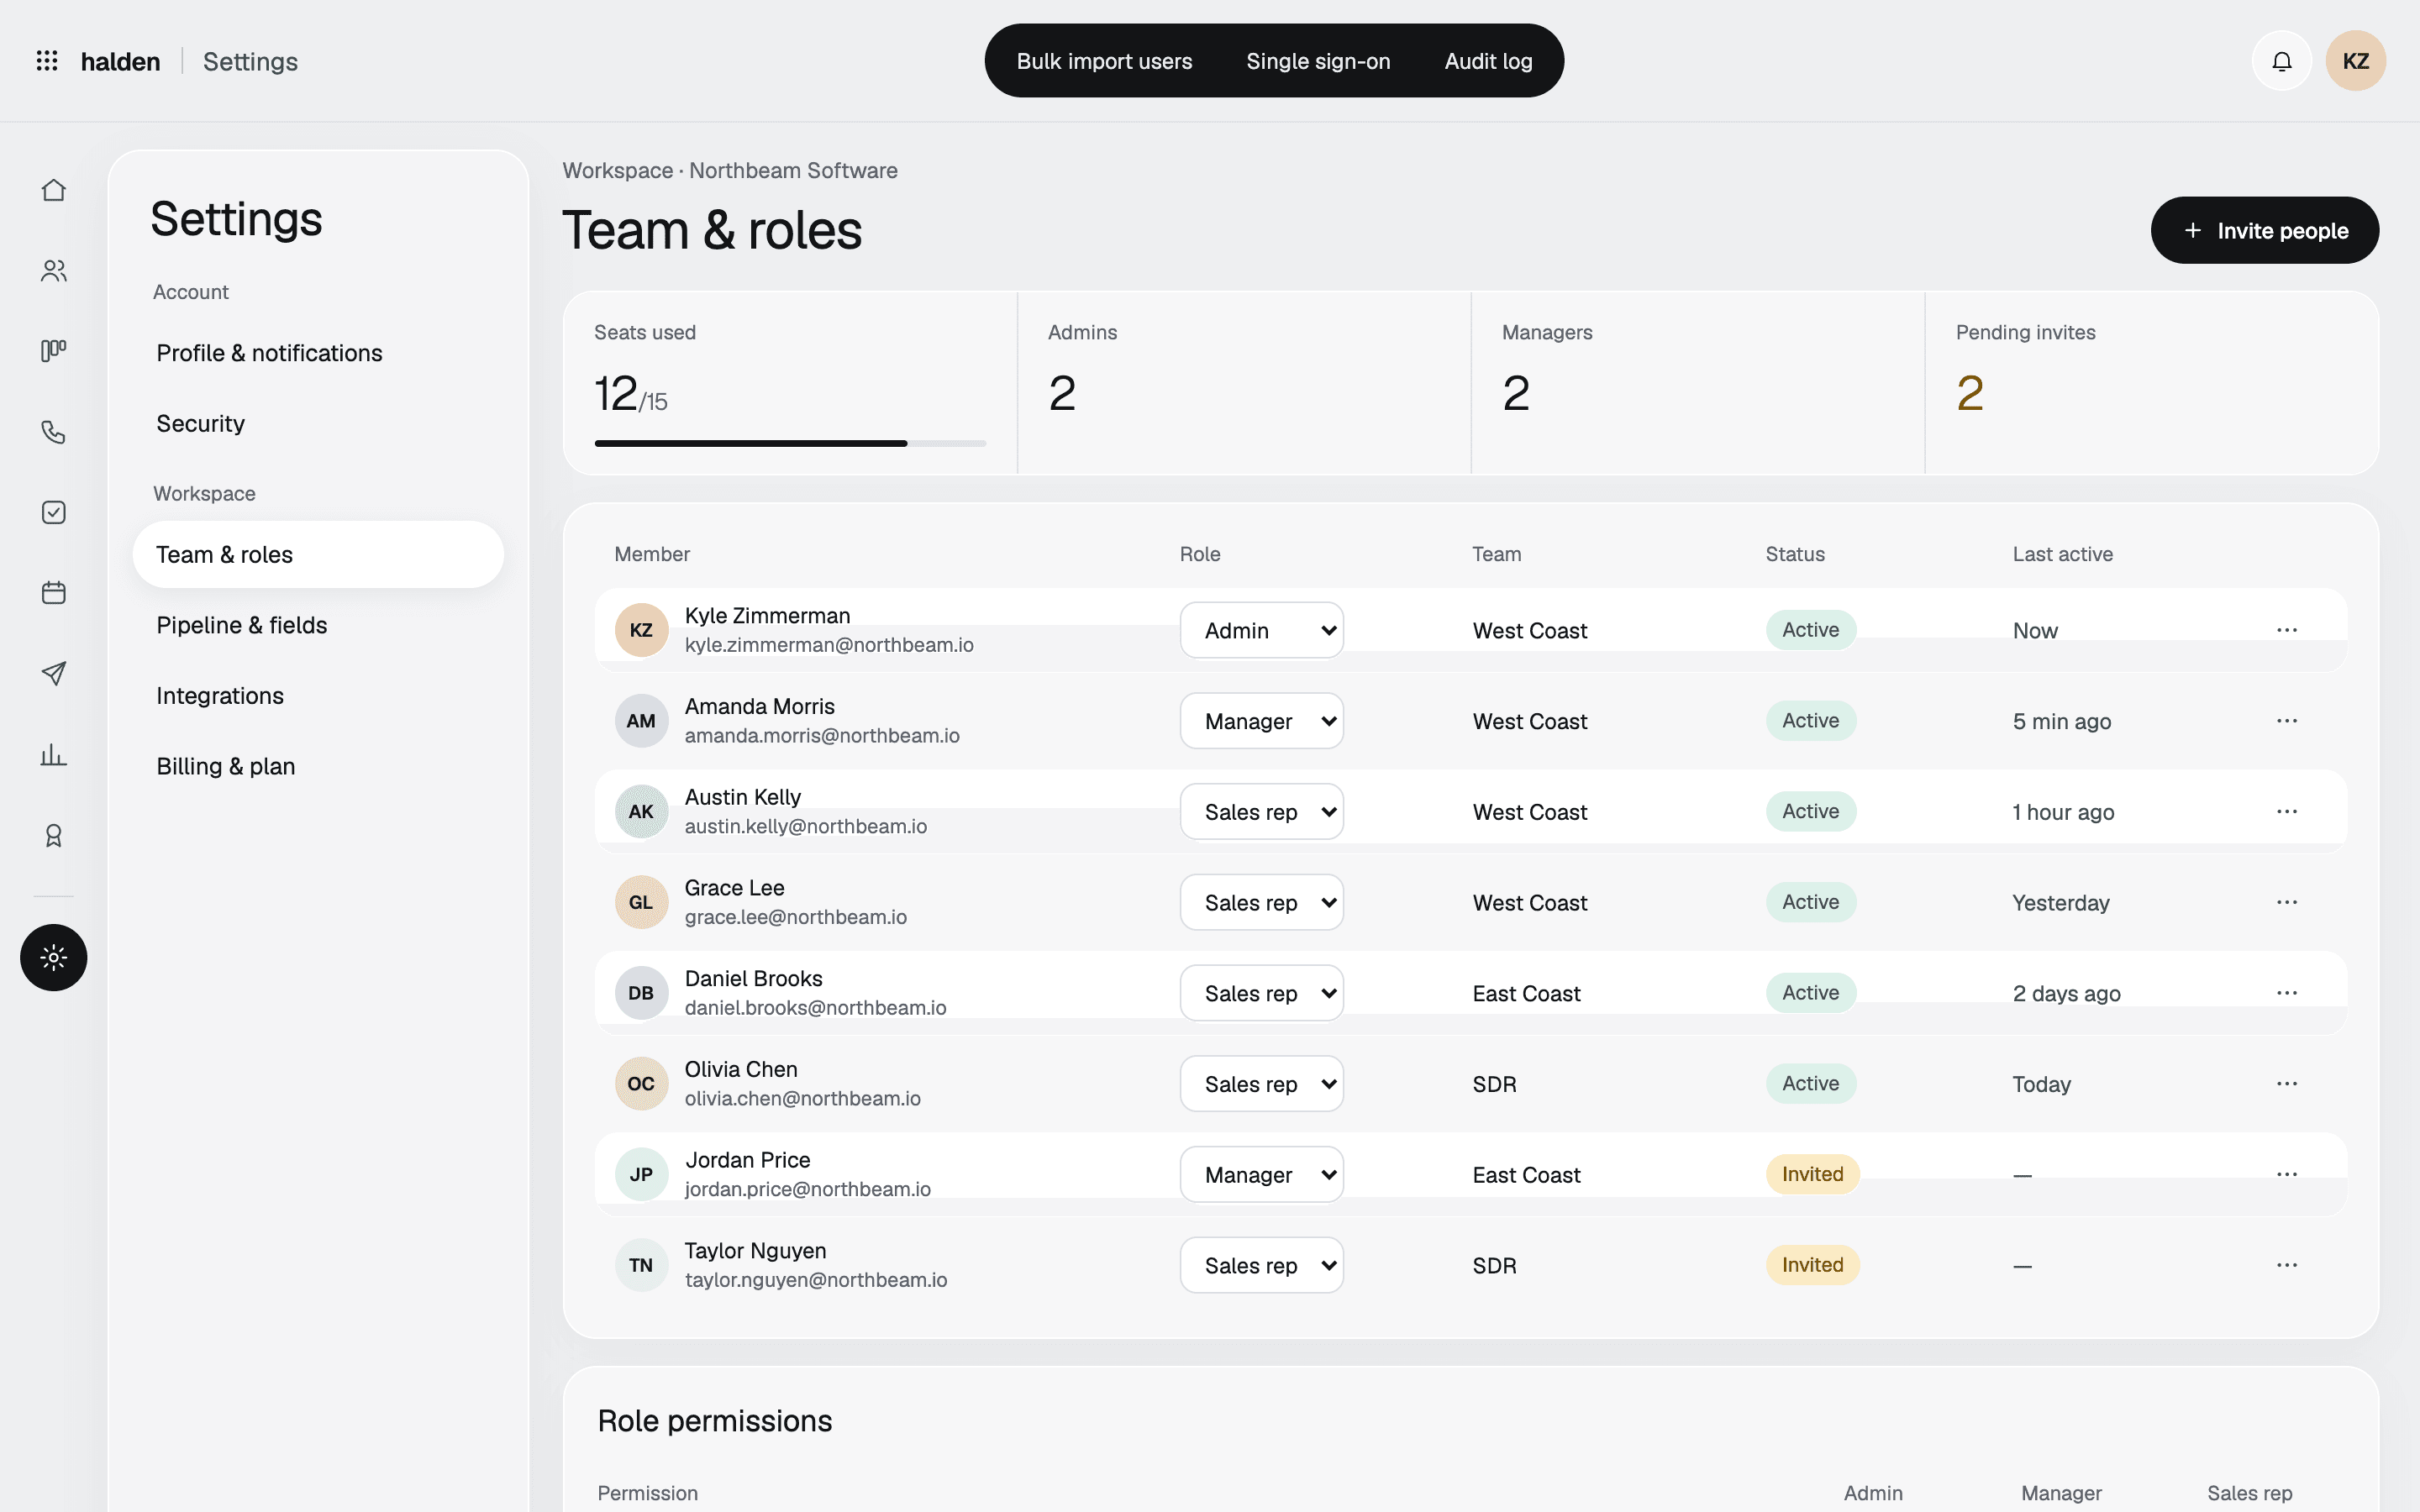
Team and rolesMembers, roles, seats, and invites. 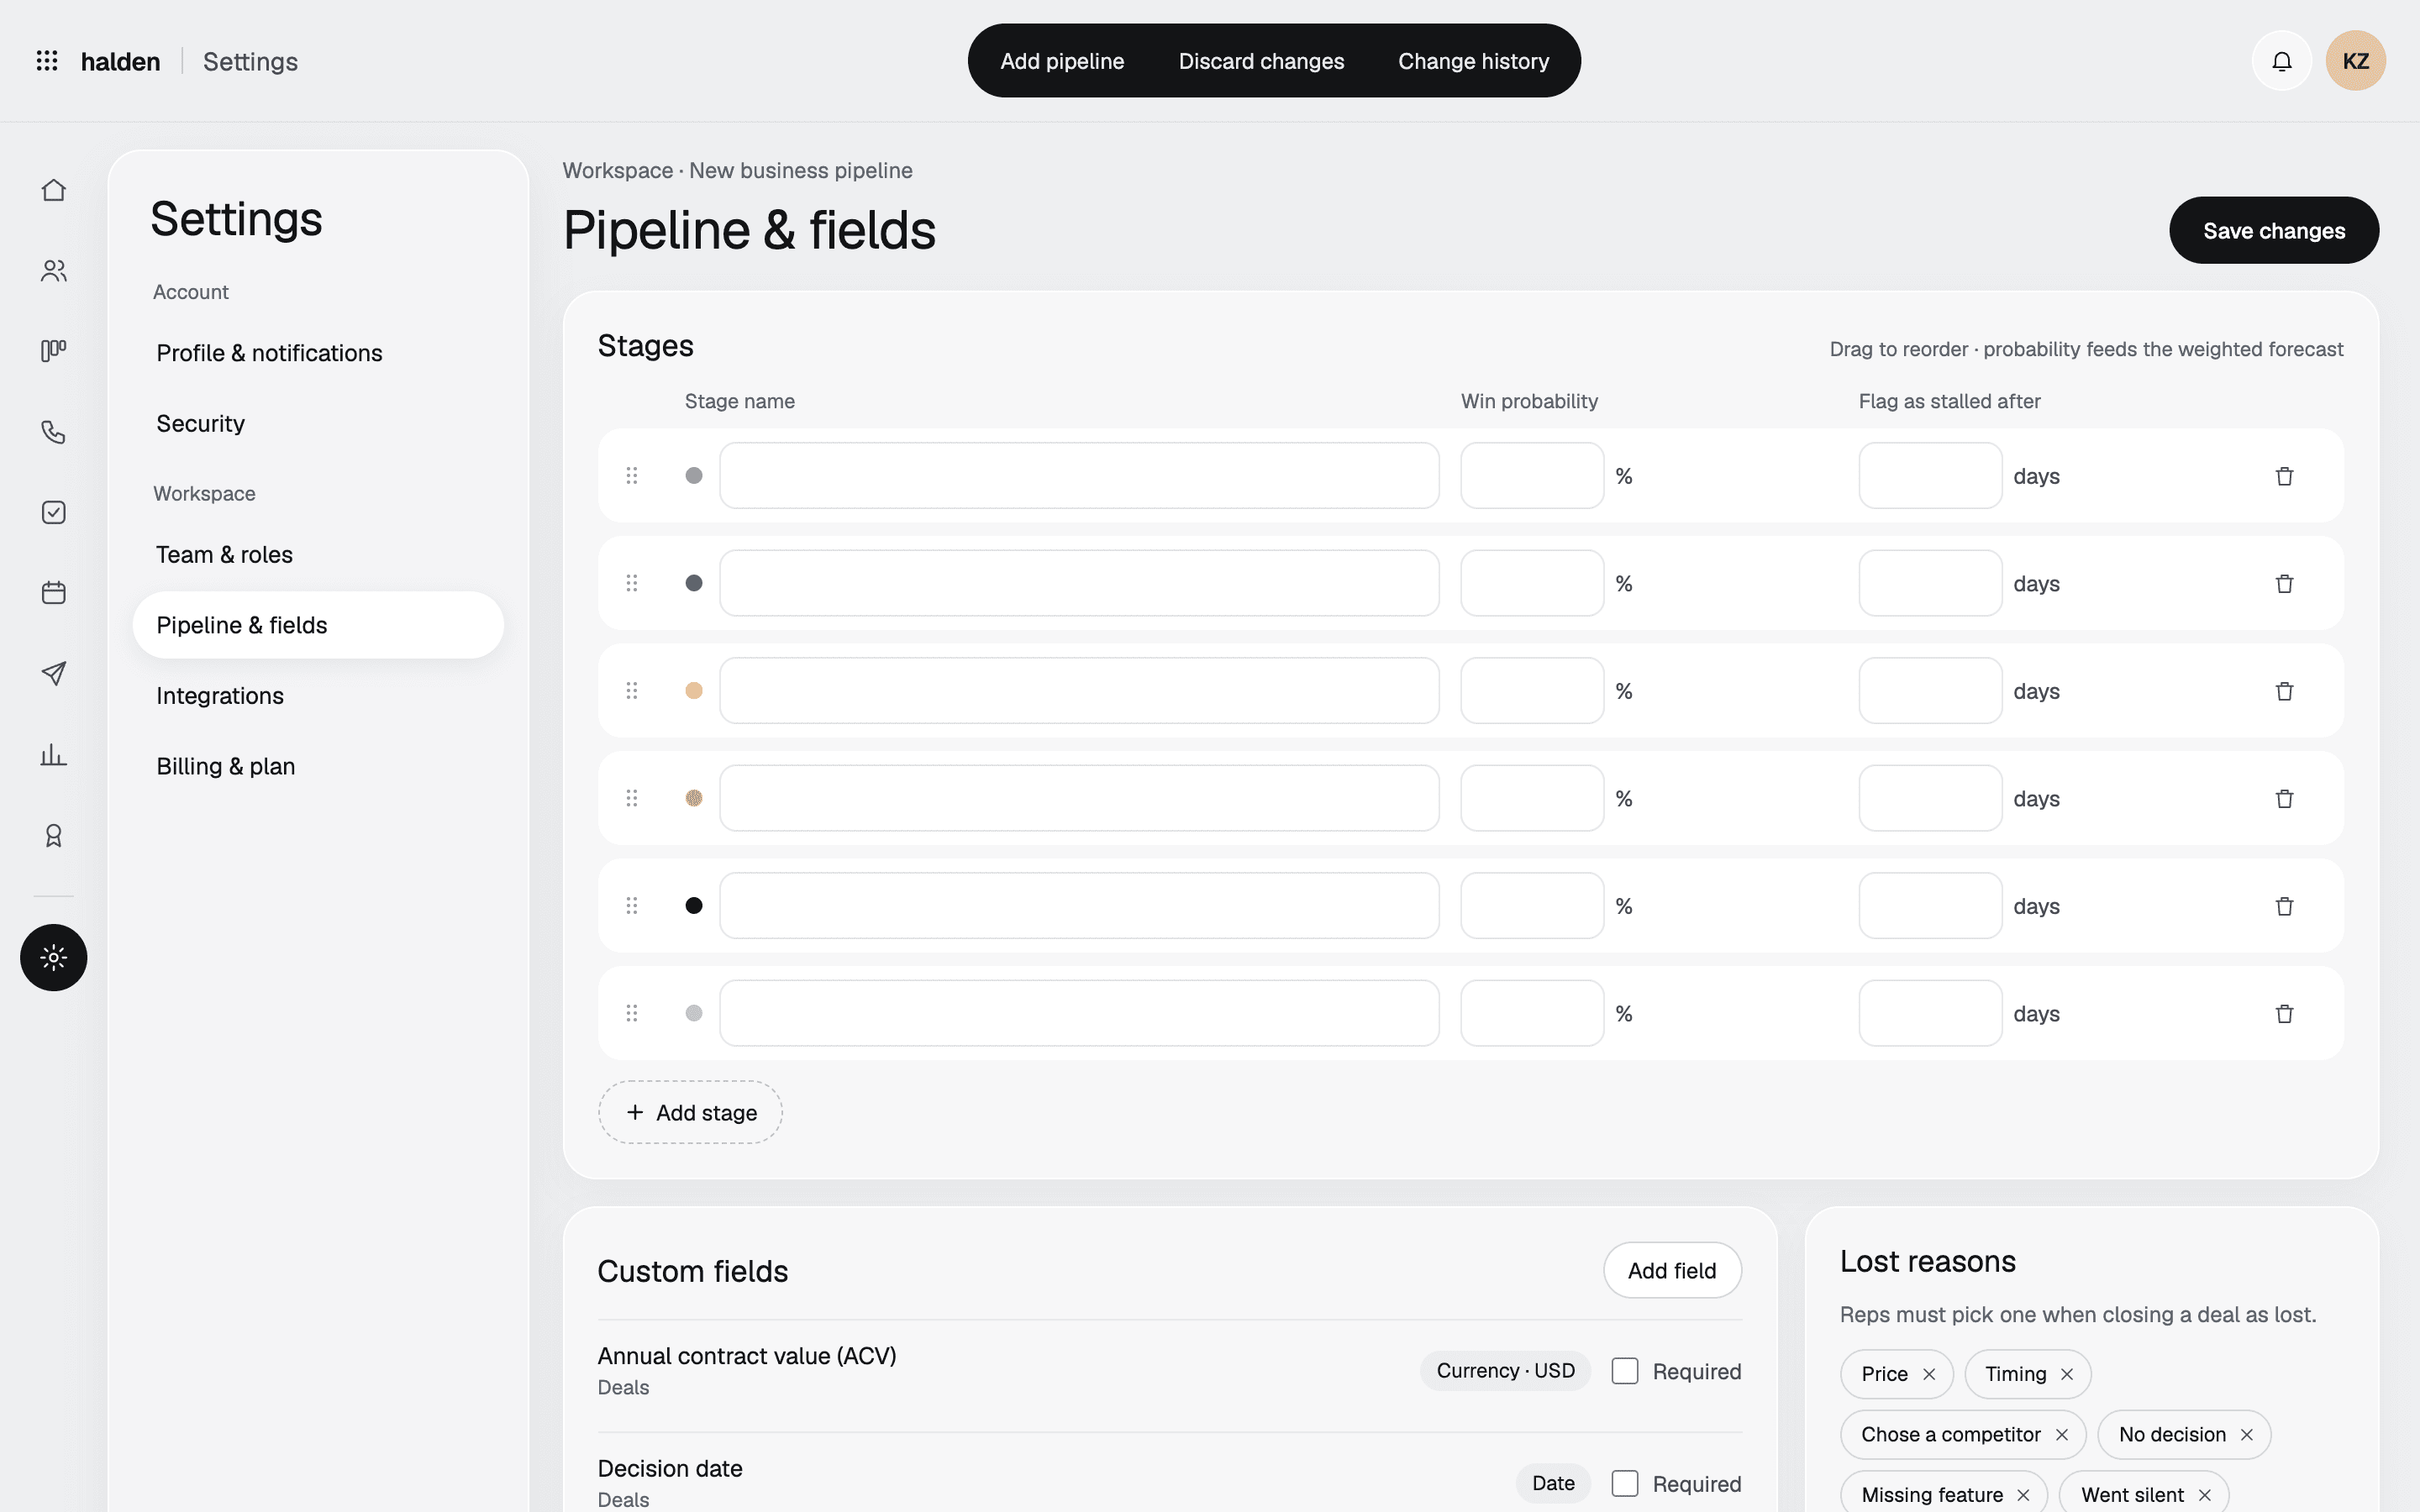
Pipeline and fieldsStages, probabilities, custom fields, lost reasons. 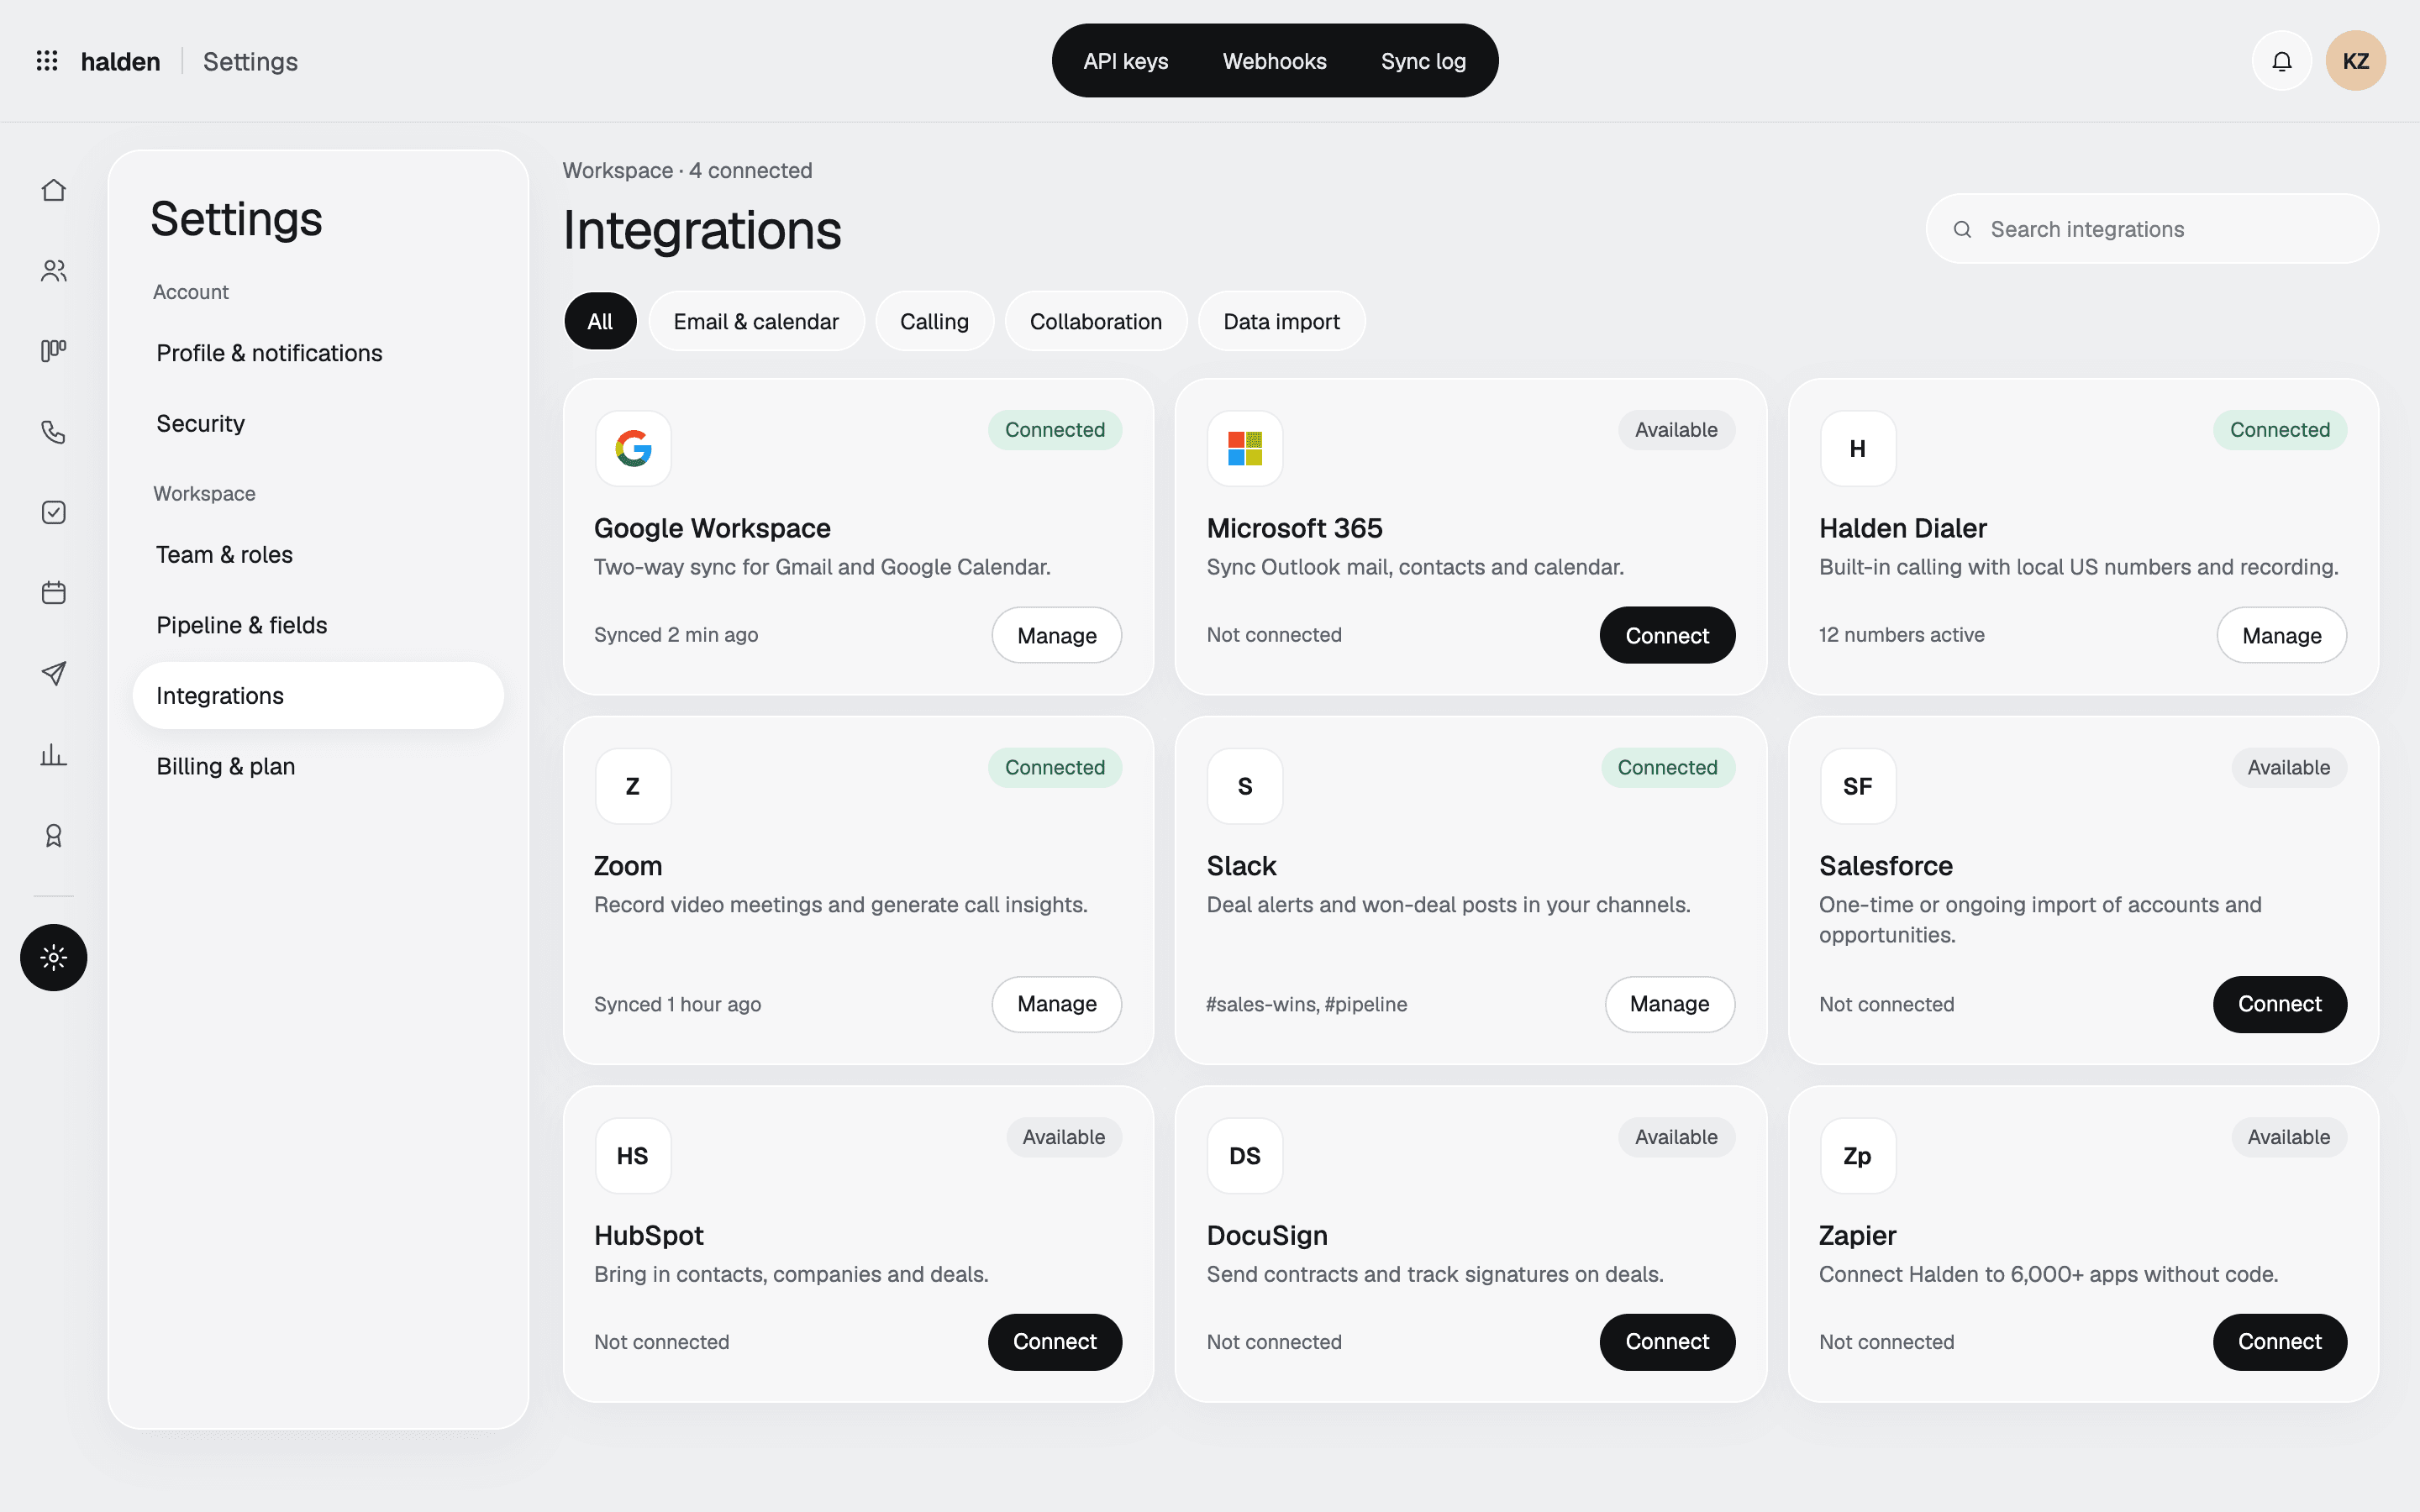
IntegrationsWhat's connected and when it last synced. 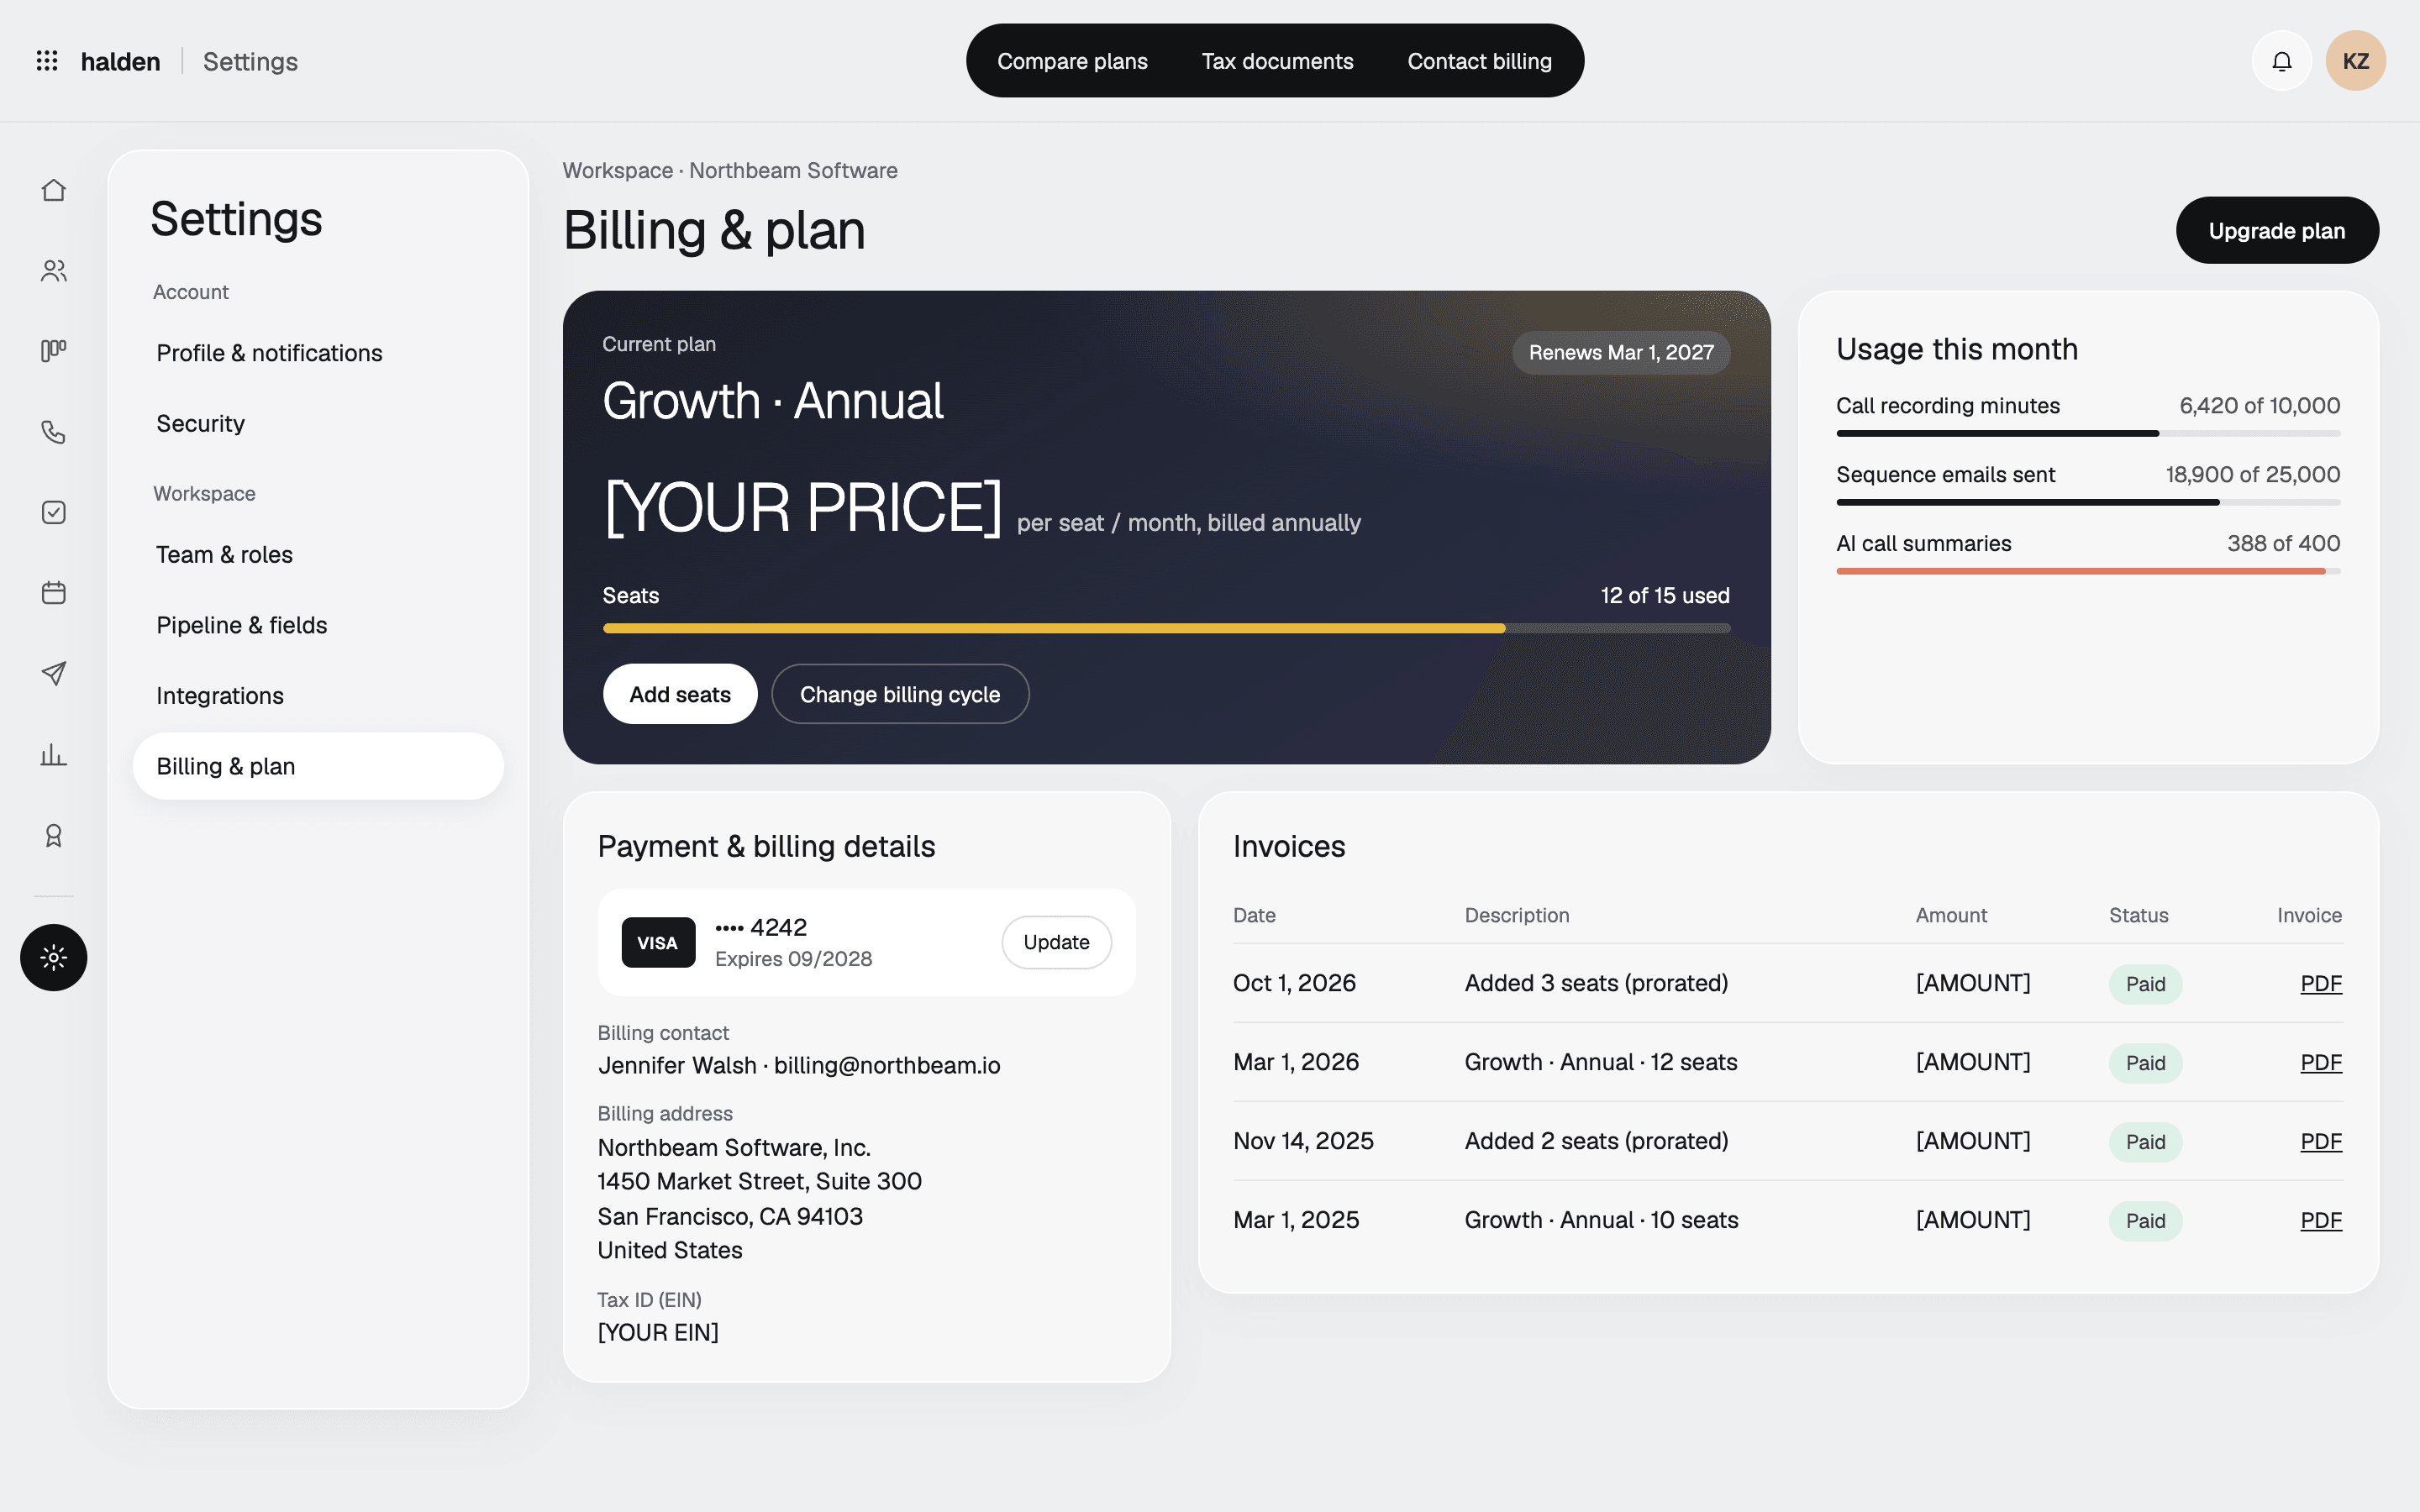
Billing and planPlan, usage, payment, and invoices.
The visual system
The interface is neutral gray and white. Color is saved for status, which makes whatever needs action the brightest thing on the screen.
- Ink#17181BType, primary actions, the action bar
- Ground#EEEFF1Page background
- Panel#FFFFFFEvery surface that holds content
- Going cold#D9583EDeals that need saving
- Follow-up#E8B93AFollow-ups due
- Ready#2A8F8CDeals ready to close
- Numbers first
- Headline figures are large, with small units beside them.
- Color means status
- Red for deals going cold, amber for follow-ups due, teal for deals ready to close.
- Actions where you need them
- Each screen has a floating bar with its main actions, like logging a call on a prospect or exporting a report.
- Built to be used
- Icon-only buttons have labels for screen readers, and forms use real labels and inputs throughout.
How success is measured
The numbers that show whether the design fixes the problem.
- Share of calls and emails that reach the CRM without manual entry
- Time reps spend on admin each week
- Number of deals left untouched for more than ten days
- How far the forecast lands from what actually closes
Next case study: Sip. A water tracker with a goal worked out for each person, one-tap logging, and reminders that stop once you're on track.
Planning an app like this? Send a few lines about it, see how a project runs week by week, or browse all our work.
Have something worth building?
- Product strategy
- iOS
- Design systems
- Launch sites
- Measurement
- Android
- Prototypes
- UX design
- MVPs
- Web apps
- UI design
Send a few lines about it. You will get an honest reply within two days, and a plan if it fits.